FractalsThe Mandelbrot Set
All the fractals we saw in the previous chapters were created using a process of iteration: you start with a specific pattern, and then you repeat it over and over again.


This is similar to another concept in mathematics that you saw before: with
Let’s take the recursive formula
Notice how the resulting sequence can behave very differently, depending on the starting value
If
If
If
So far, we’ve not learned anything new. However, about one century ago, mathematicians started to explore what happens to these sequences if you use
Julia Sets
Let’s use the same sequence as before,
As you can see, the sequence converges as long as
Now let’s make things a bit more difficult. Rather than just squaring the previous number, we also add a constant c every time (which can be any complex number). In other words,
In this diagram, you can move the position of
We already know what happens if – that’s the same as the example above. The sequence convergence as long as
As soon as we change the value of c, something wonderful happens. The circle transforms into a highly complex, fractal shape.
When , the shape divides into infinitely many tiny elements arranged in spirals.
In some cases, the sequence doesn’t converge to a single point – instead it reaches a cycle of multiple points, like a triangle. These cycles are called orbits.
Points that are coloured blue mean that the corresponding sequence either converges or has an orbit (we say that it is bounded). Points that are left white mean the corresponding sequence diverges: it is not bounded, and eventually blows up to infinity.
What else can you find? Have a look at the patterns when or when . There are also some values of c where every sequence diverges, so the entire complex plane remains white.
The different shapes that are formed by colouring in the numbers are called
At that time, there were no computers to help visualise what Julia sets actually looked like. Mathematicians like Julia and Fatou were able to reason about them mathematically, but they only ever saw rough, hand-drawn sketches of what they might look like.
We don’t have this problem today – the images below are all of different Julia sets. The different colours indicate how quickly the sequence at that point diverges:
The Mandelbrot Set
When creating the different Julia sets, you might have noticed that there were some values of c for which every sequence diverges, and the entire complex plane remains white. A few decades after Julia and Fatou, a new generation of mathematicians tried to map what these areas looked like.
In the previous example, we chose a fixed value for
Once more, paint over the complex plane to reveal the area in which sequences remain bounded. What shapes do you expect to appear?

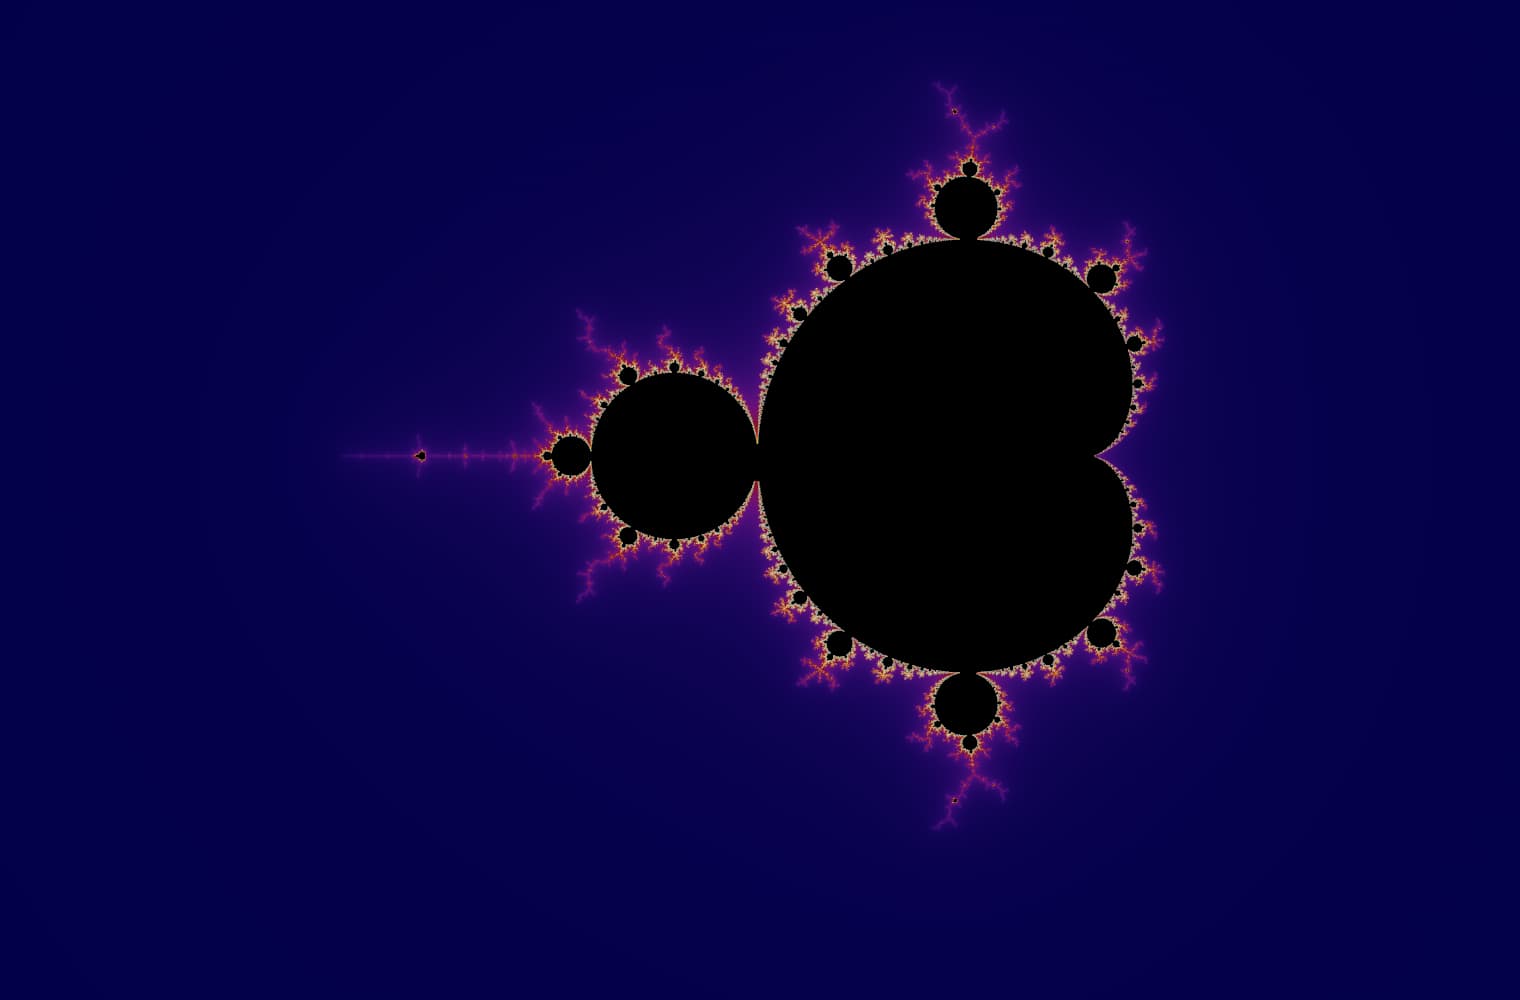
This fractal is called the
A few years later,
Like all fractals, we can “zoom into” the Mandelbrot set forever, finding new patterns at every scale. Here you can zoom into a part of the Mandelbrot set that is called the Seahorse valley. Black points are inside the Mandelbrot set, where the sequence is bounded. Coloured points are outside the Mandelbrot set, where the sequence diverges, and the different colours indicate how quickly it grows to infinity:
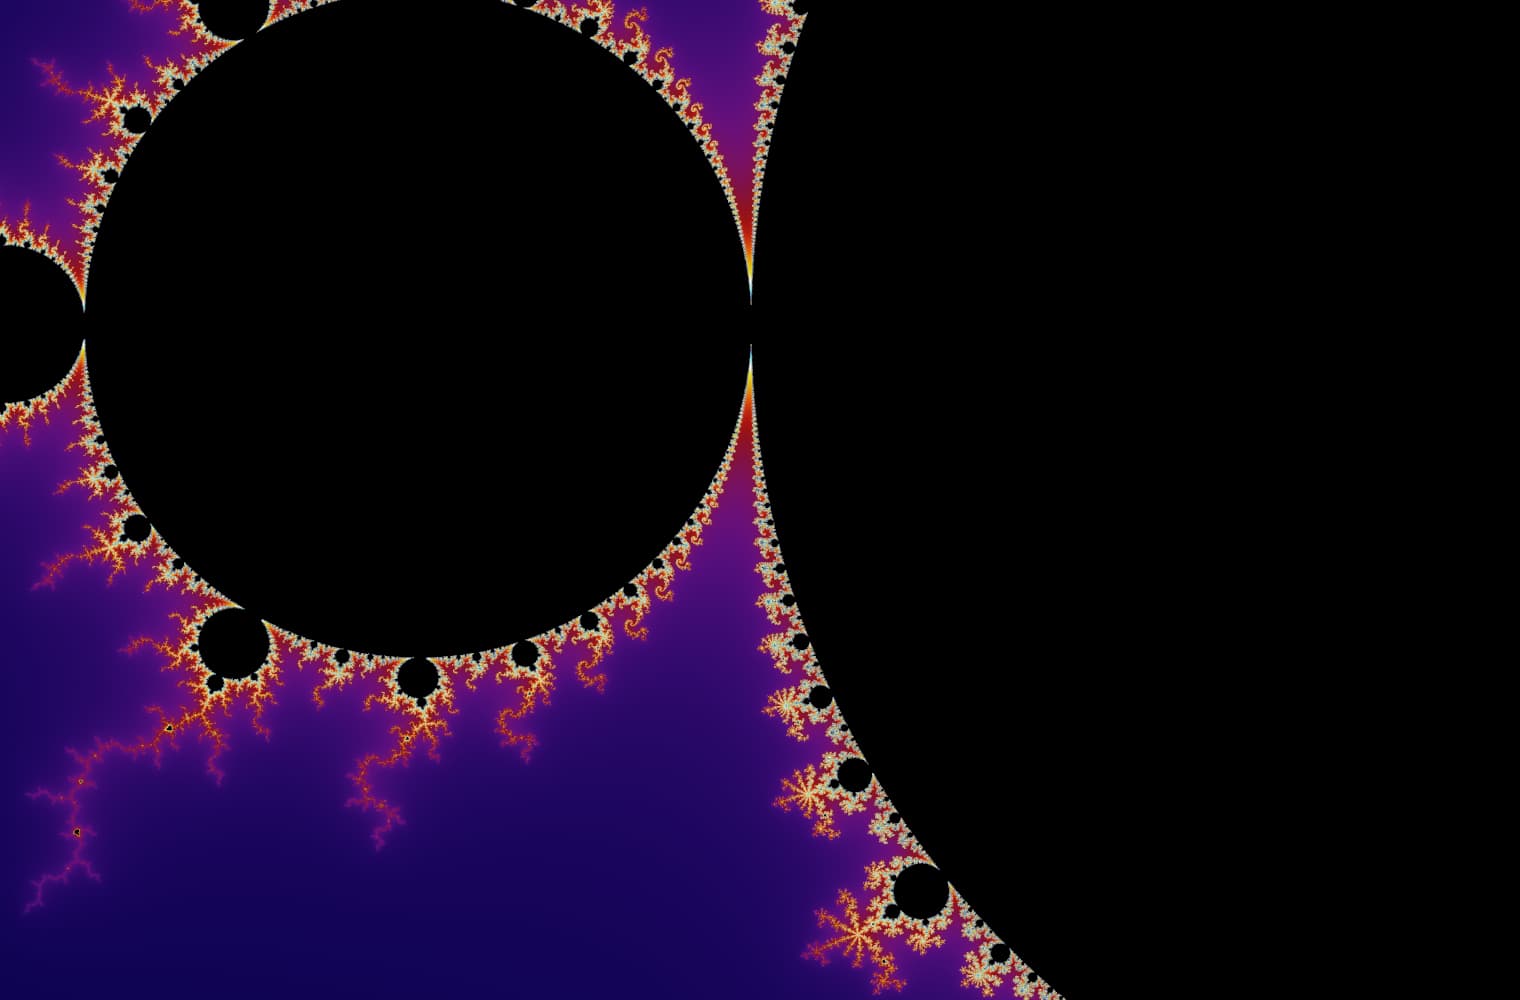
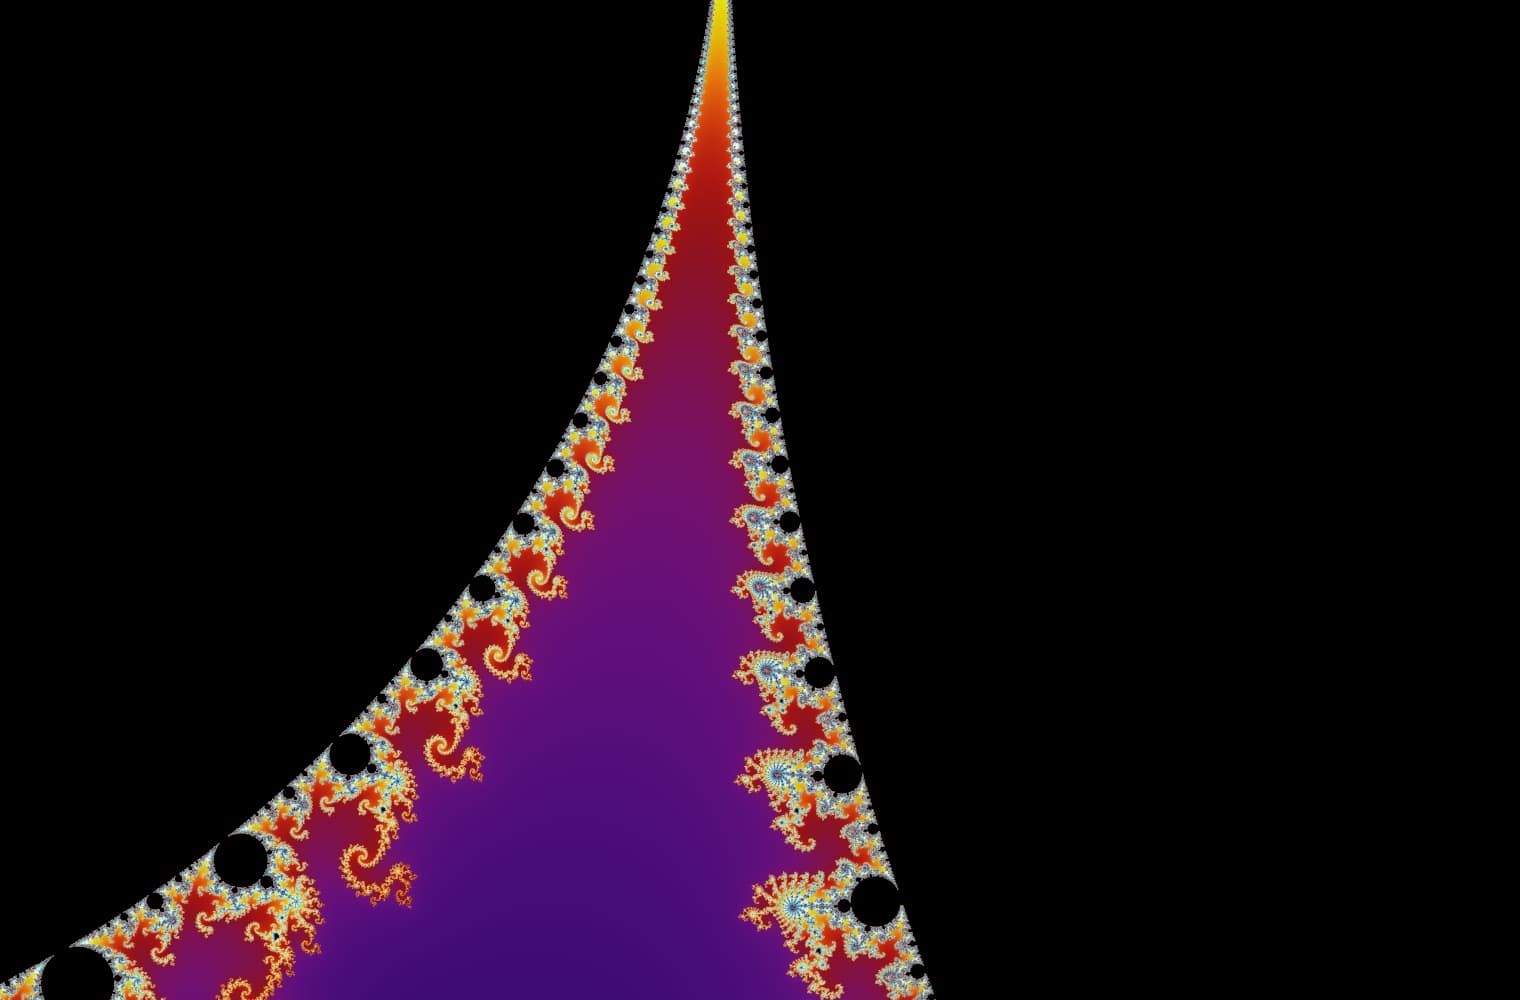
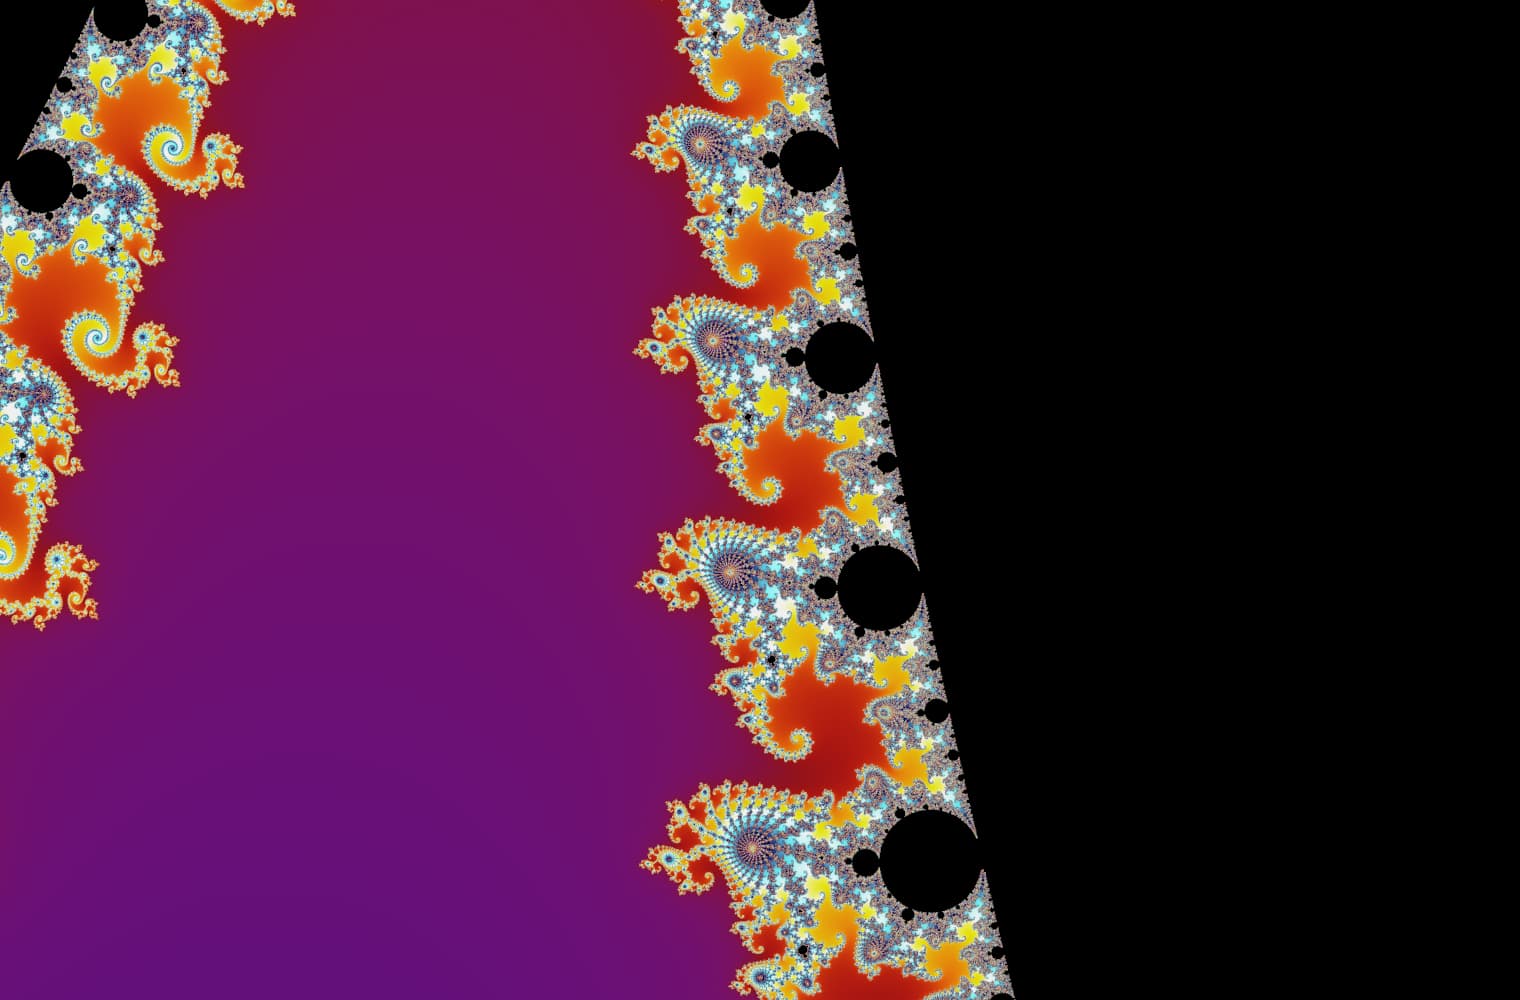
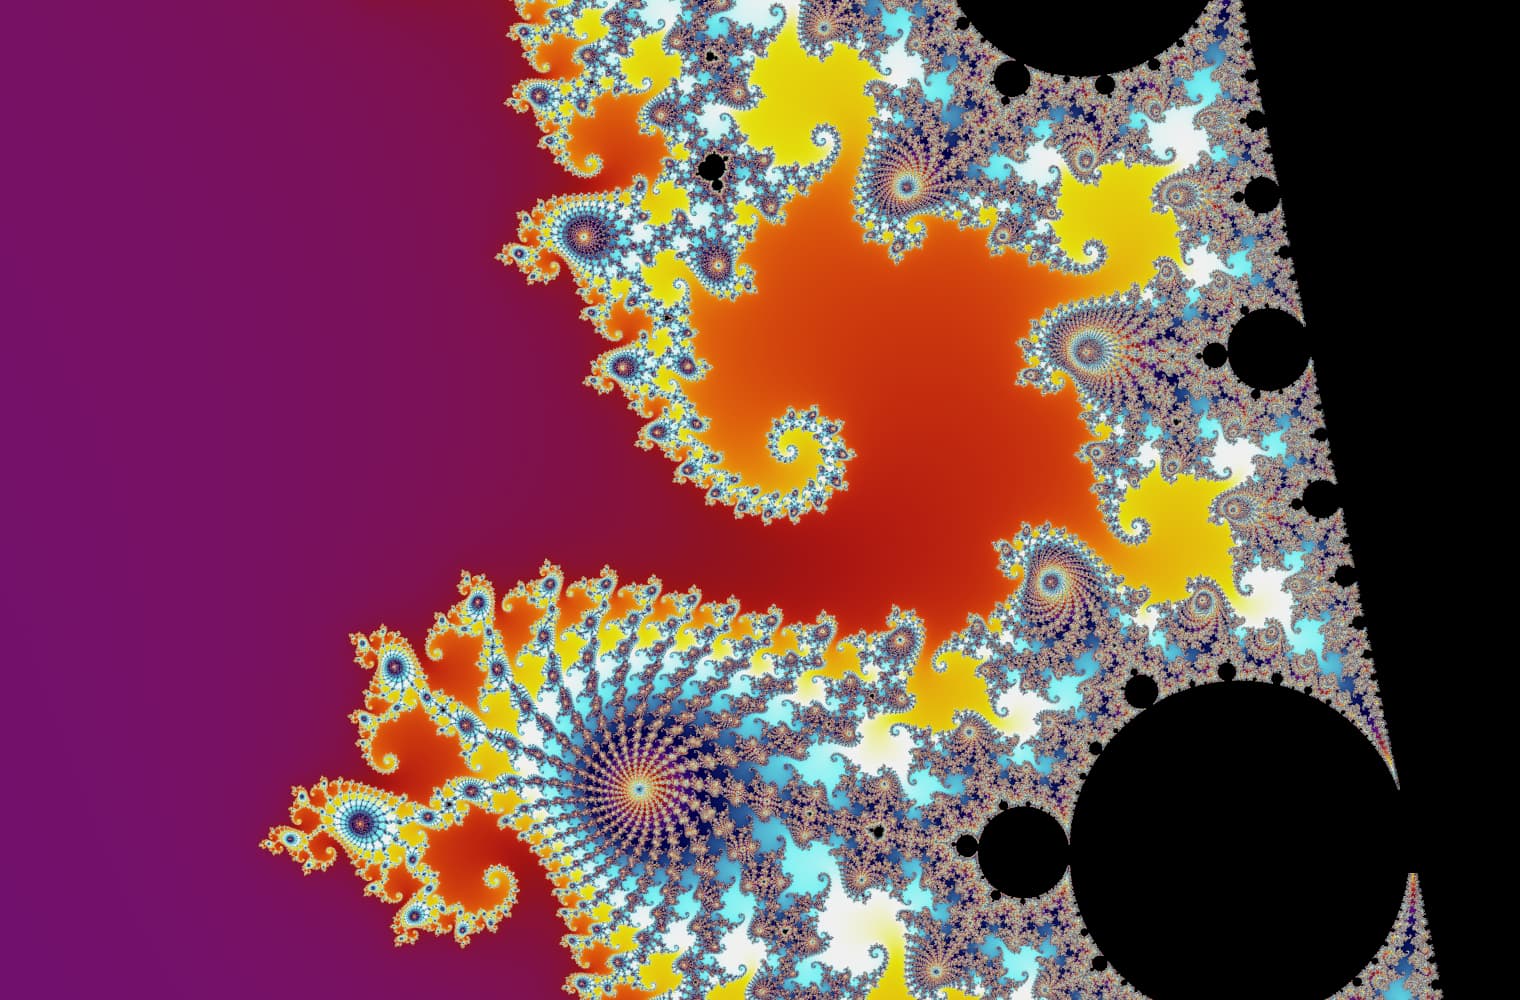
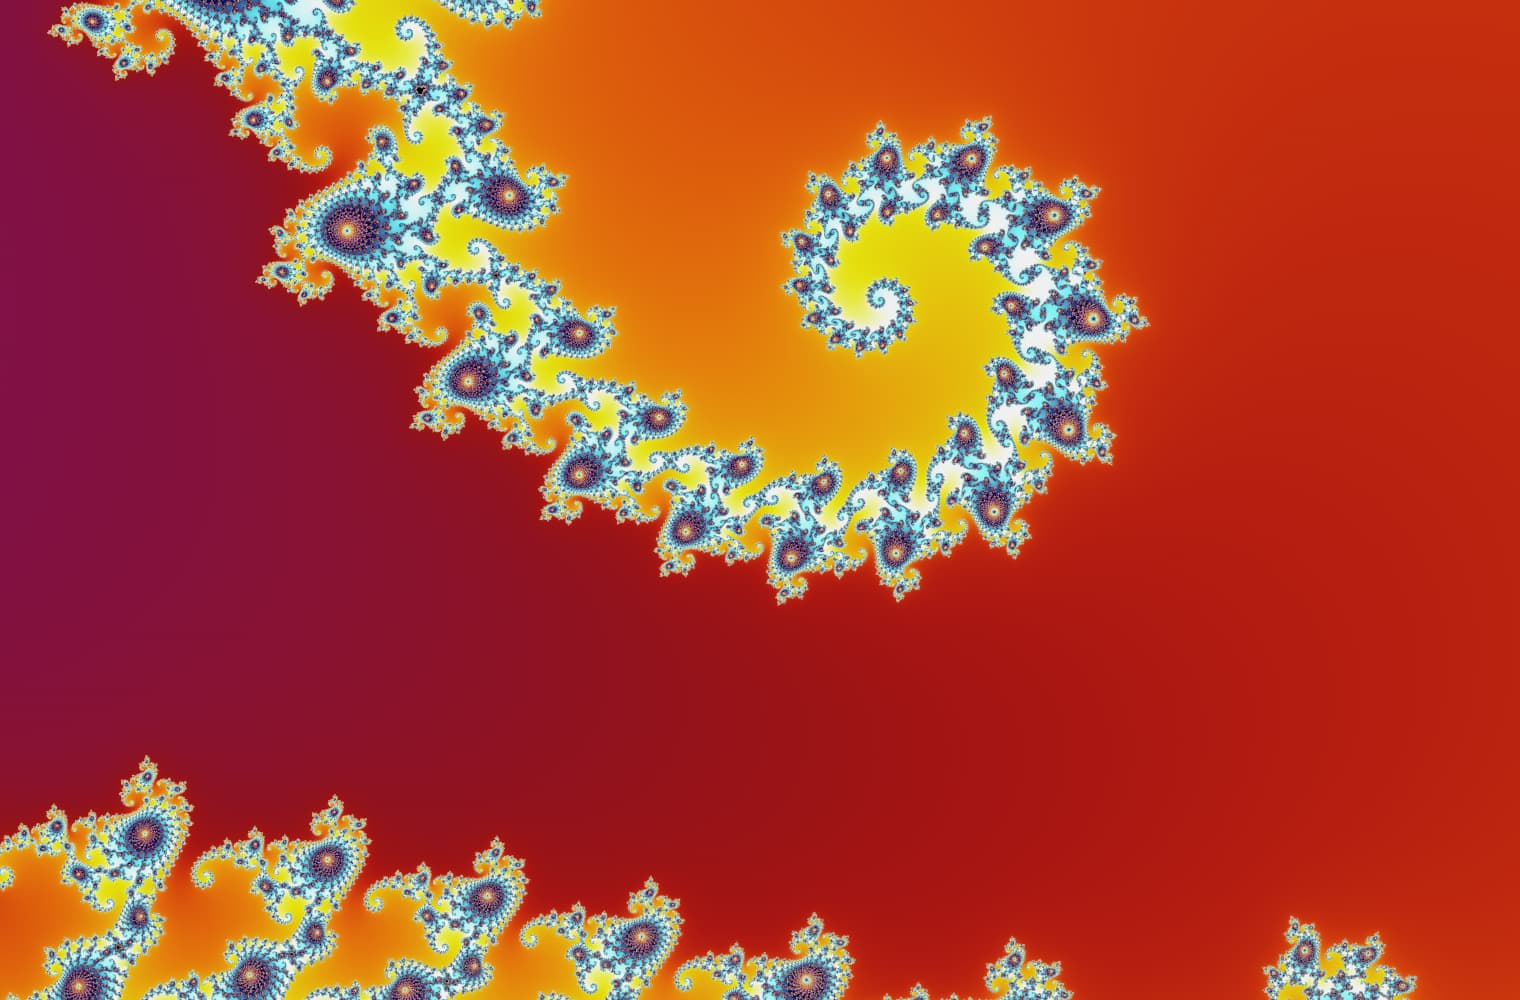
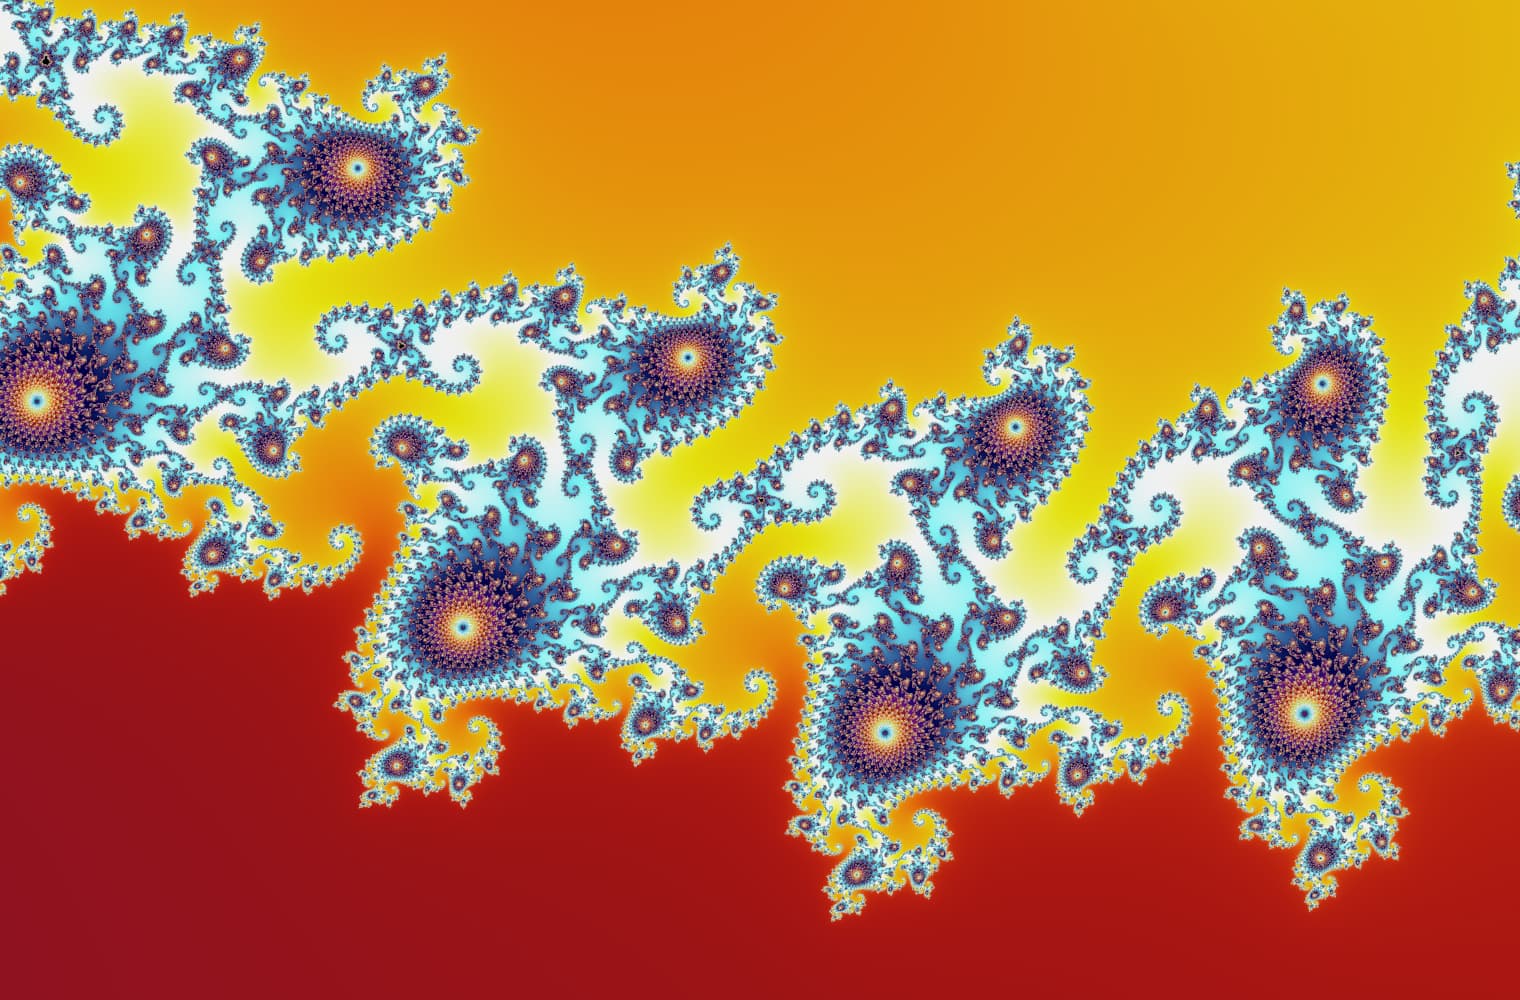
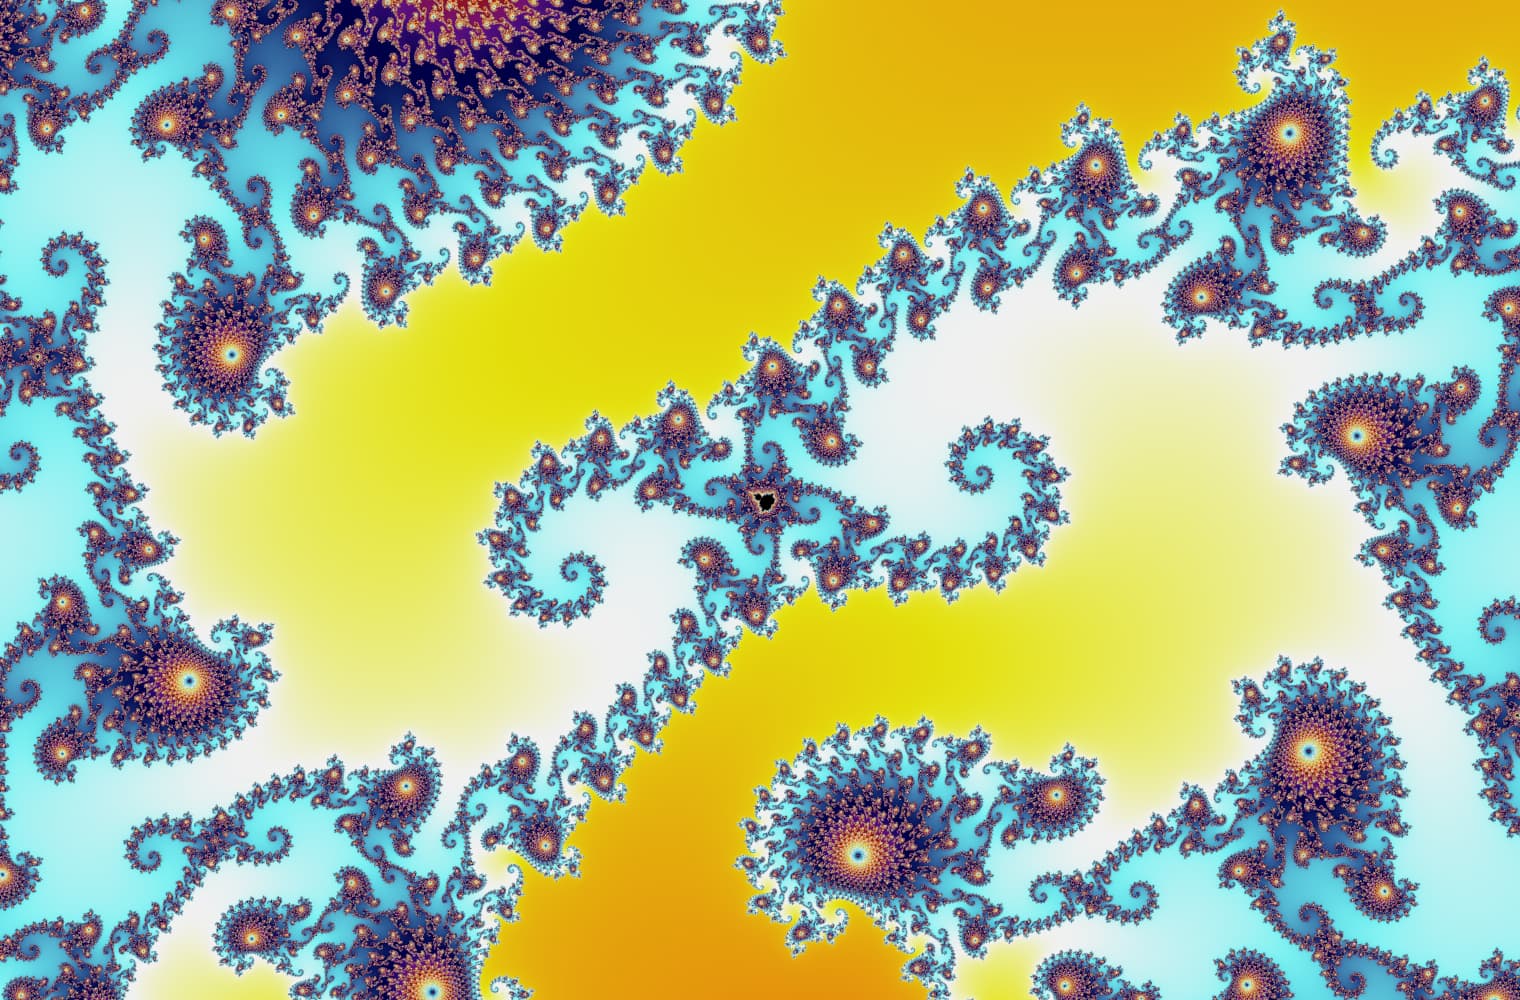
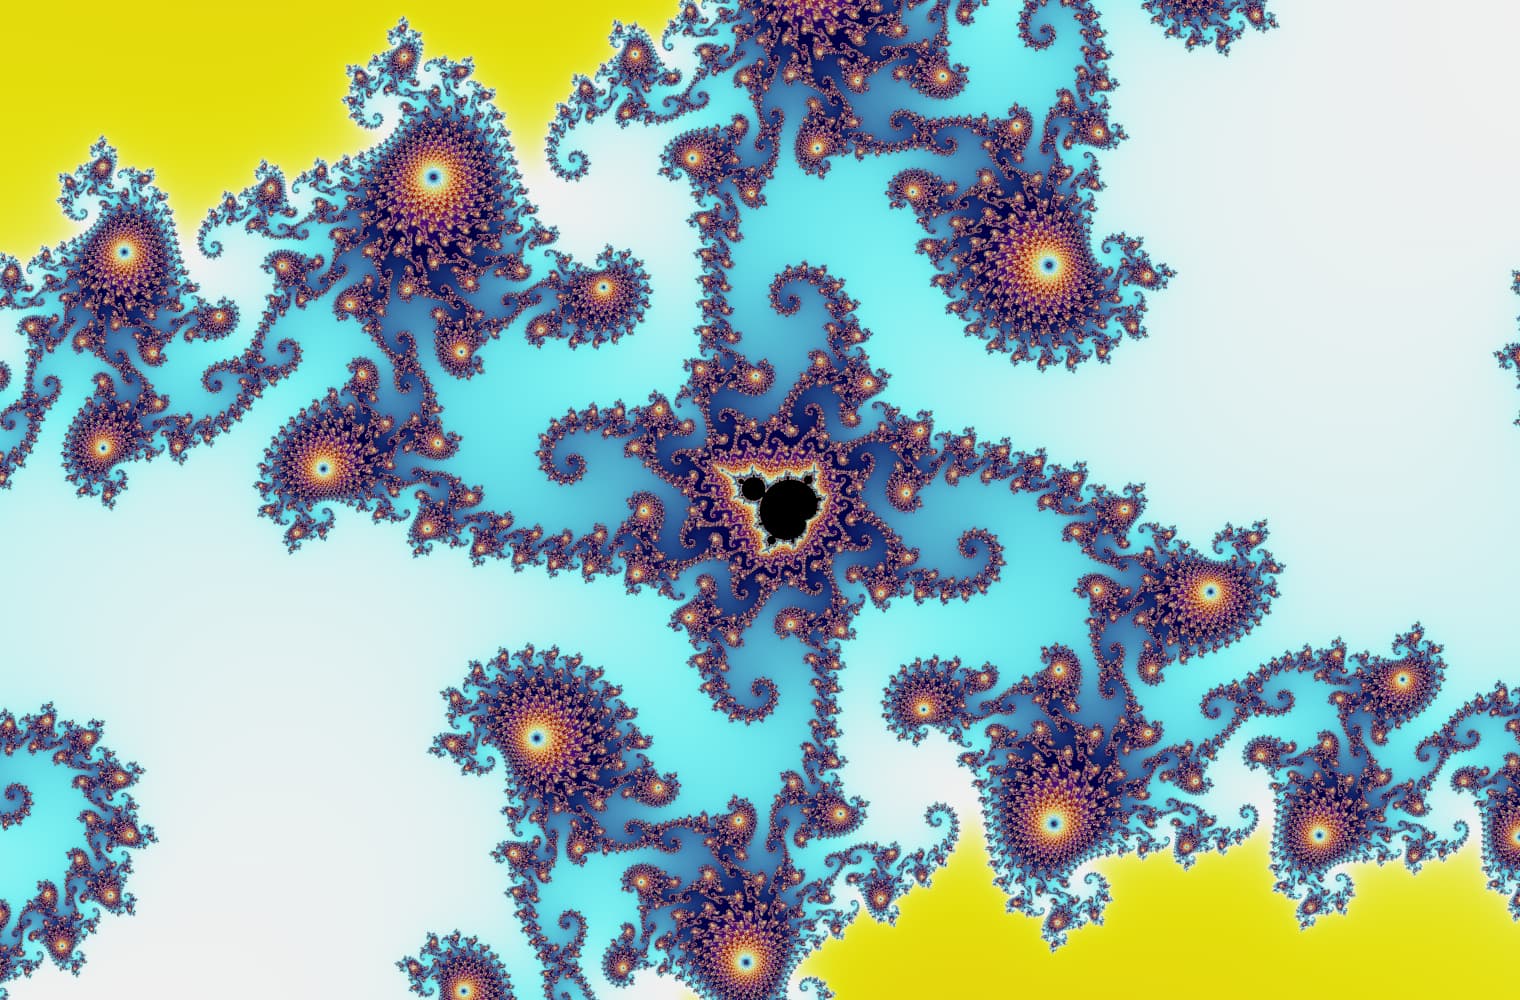
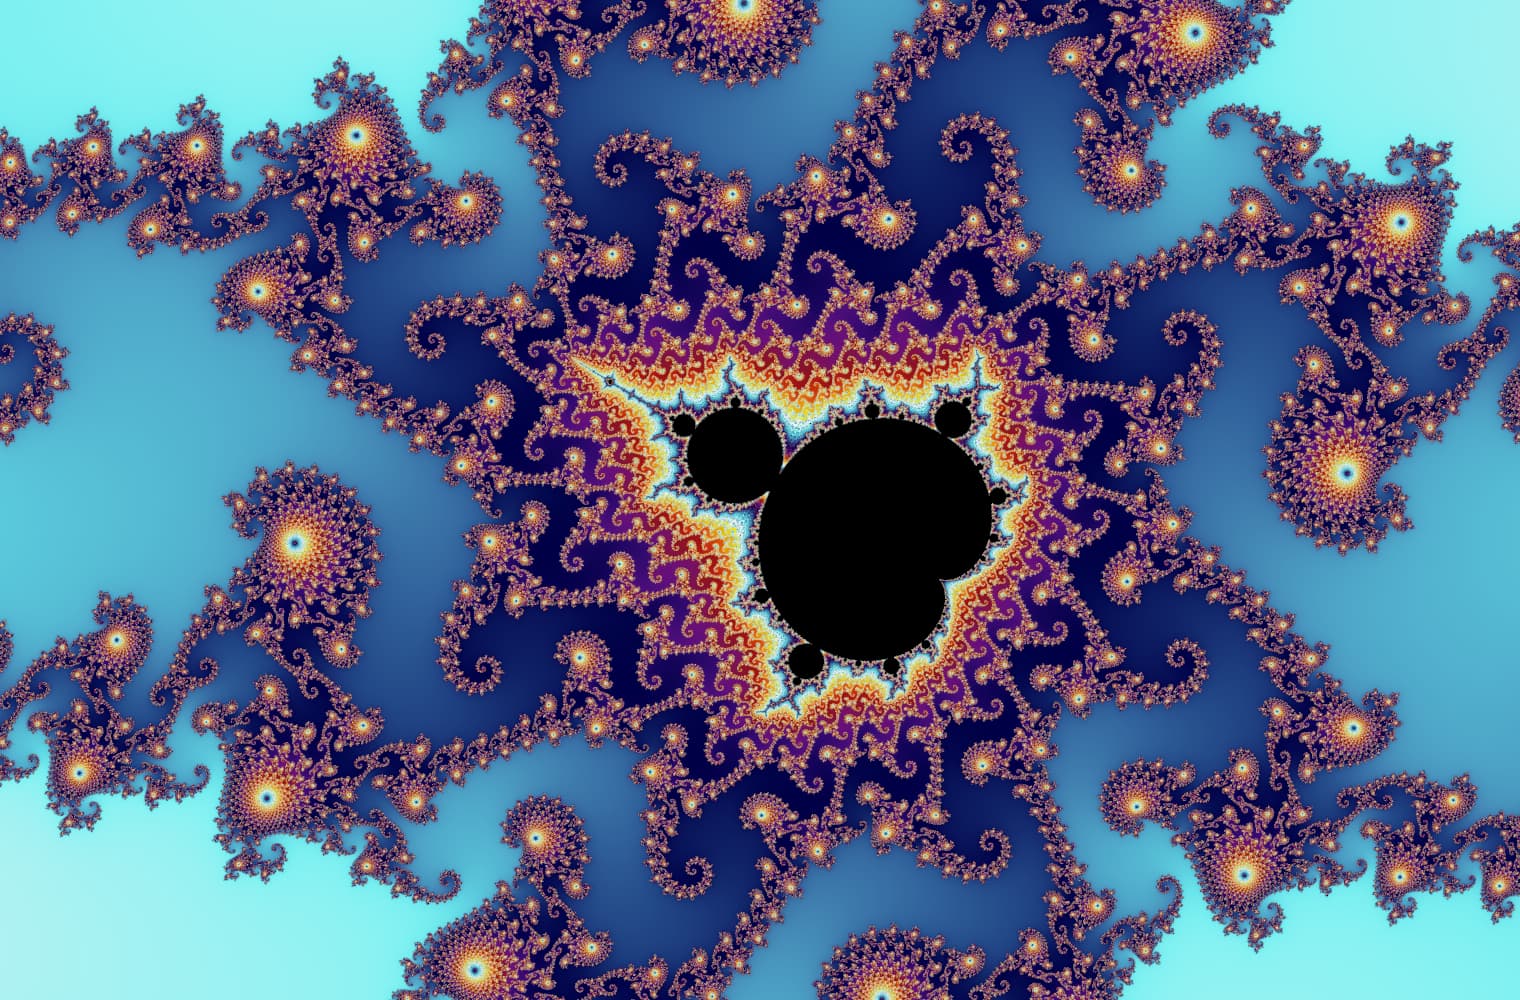
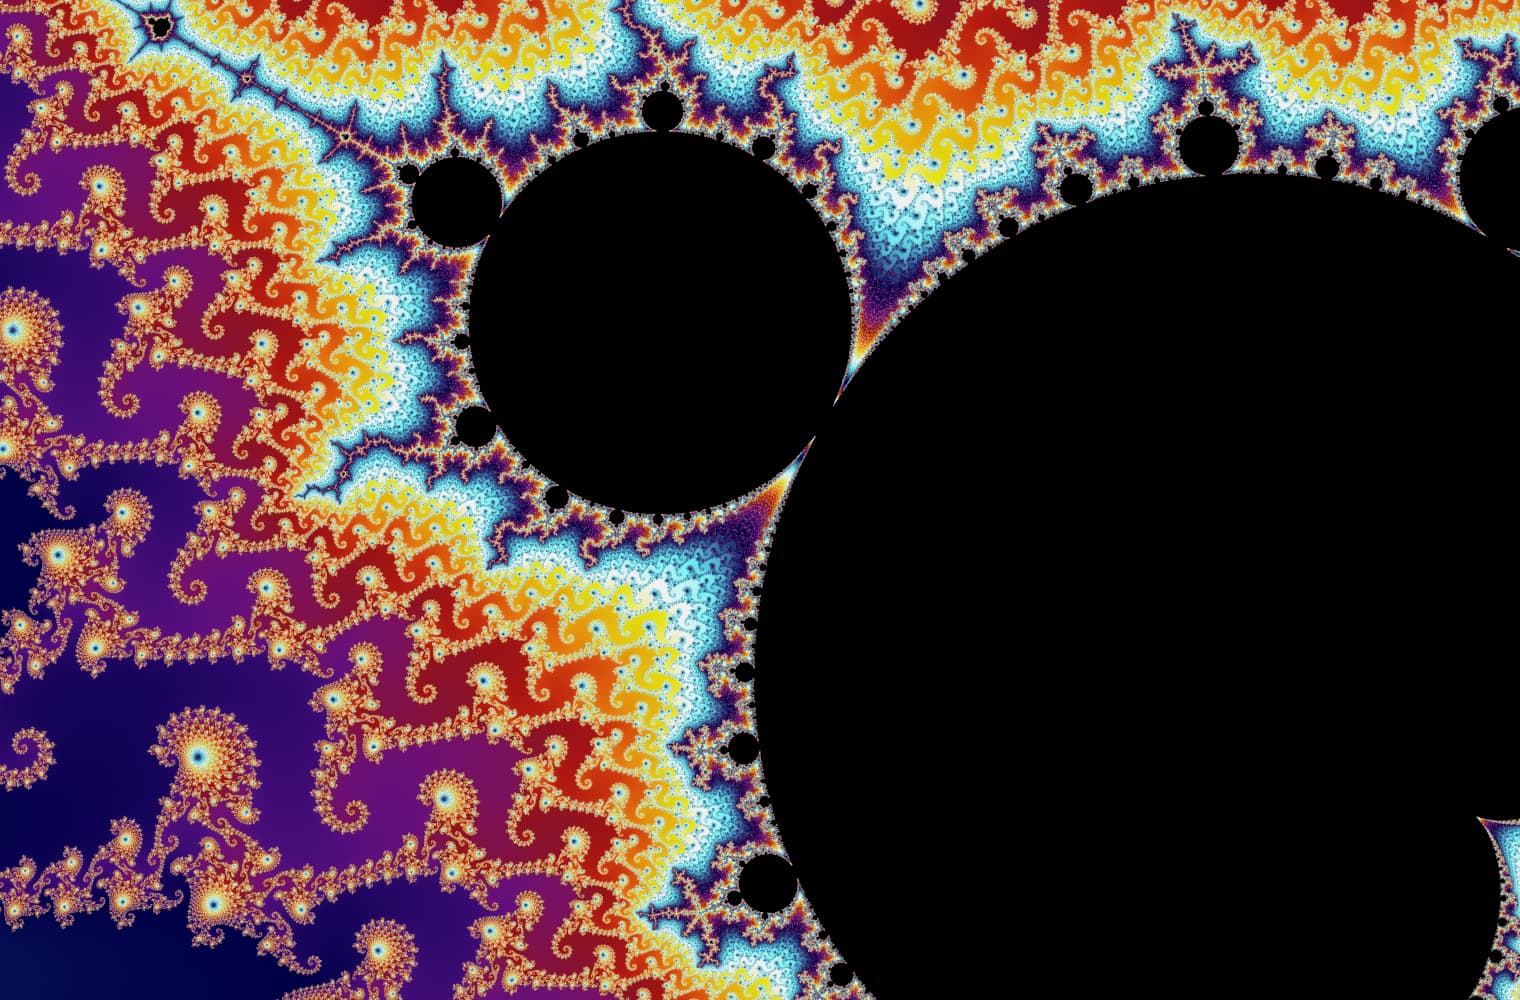
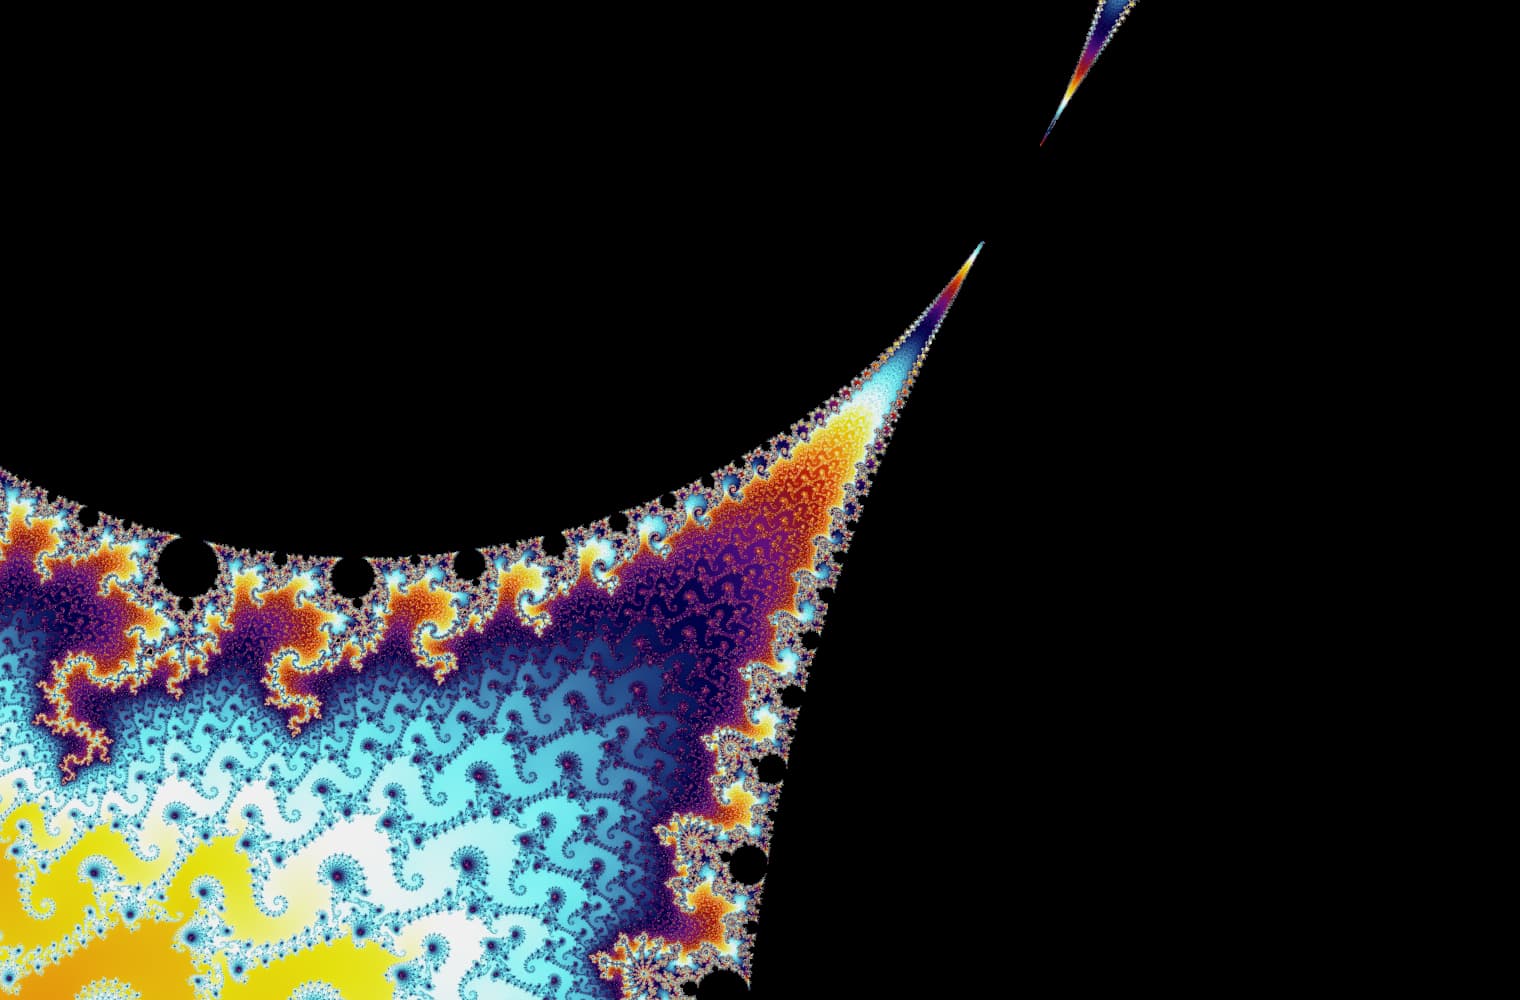
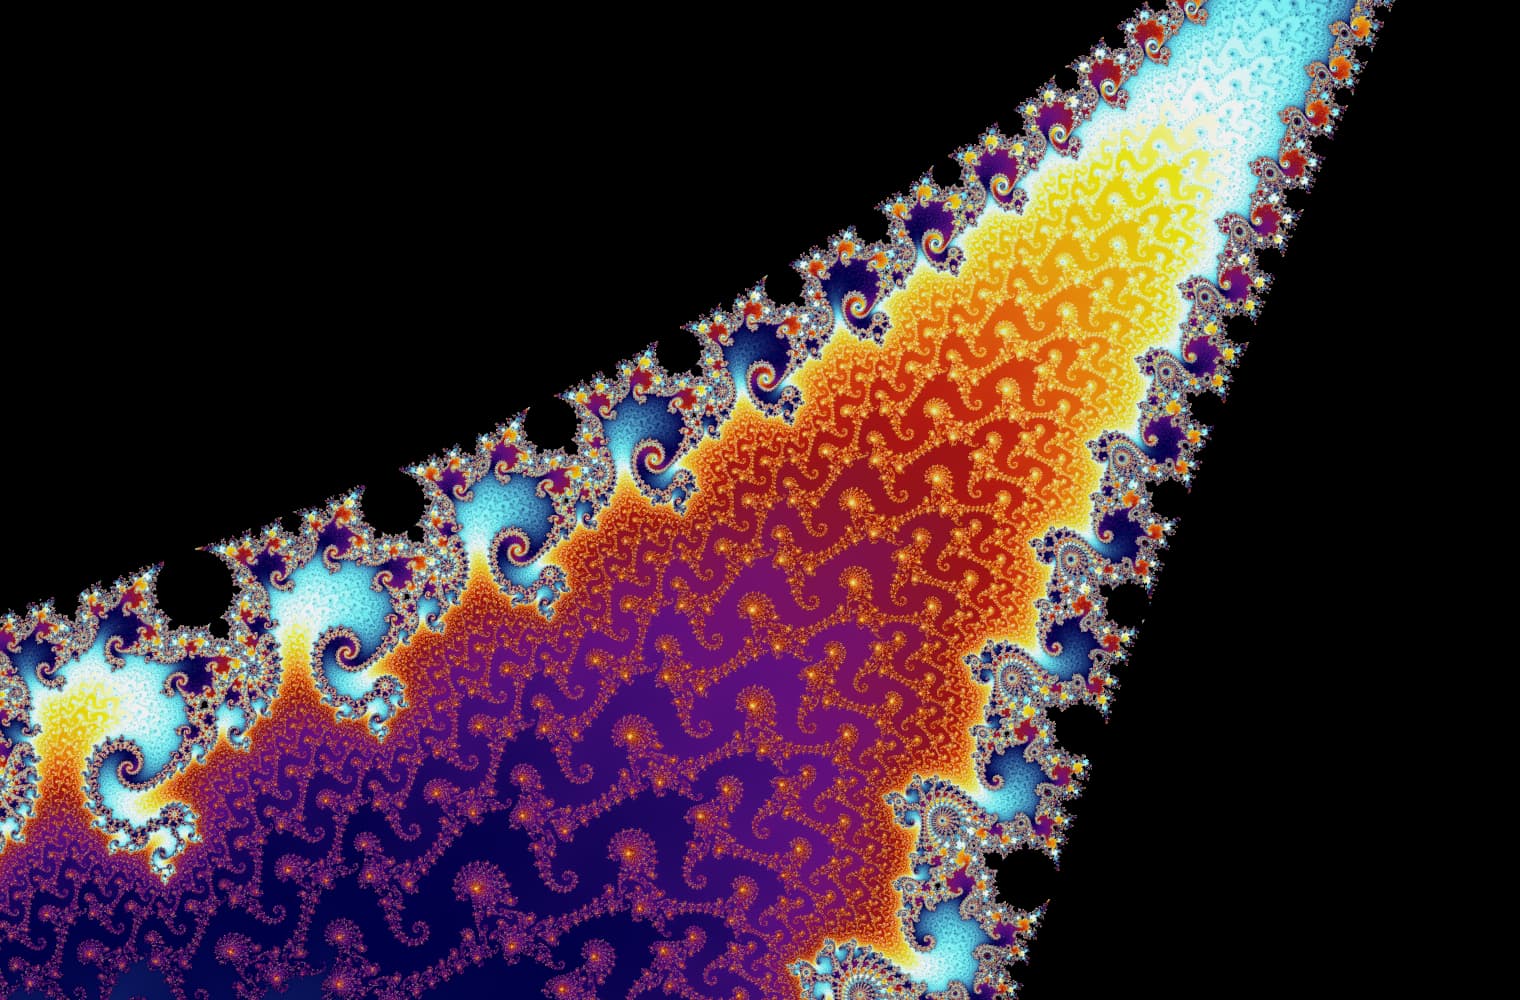
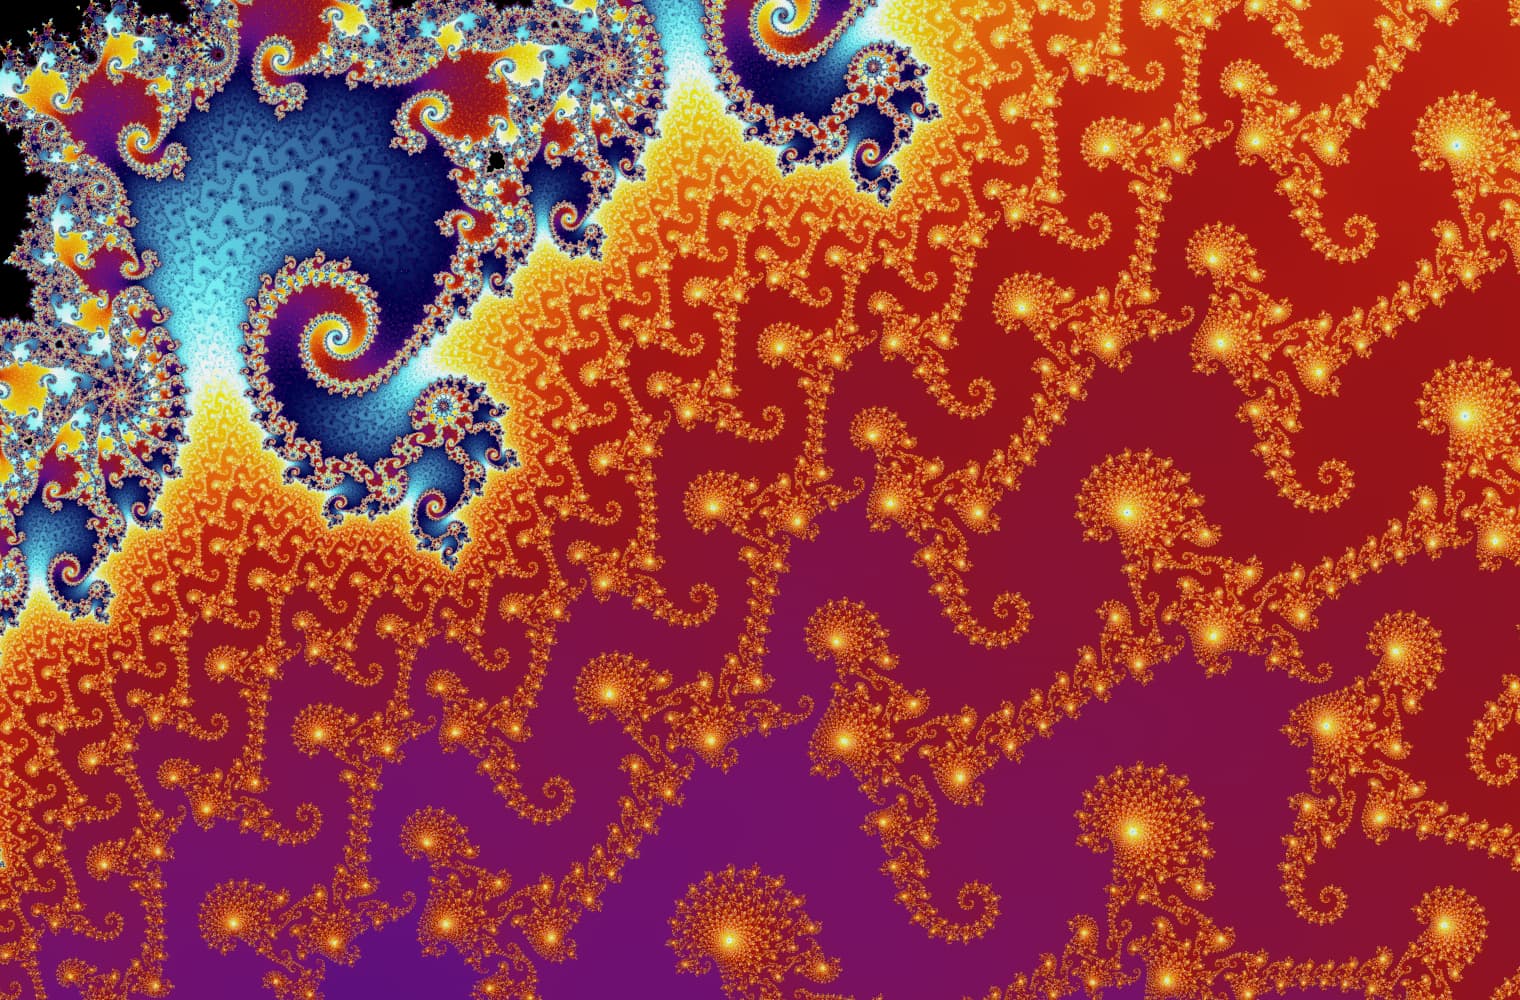
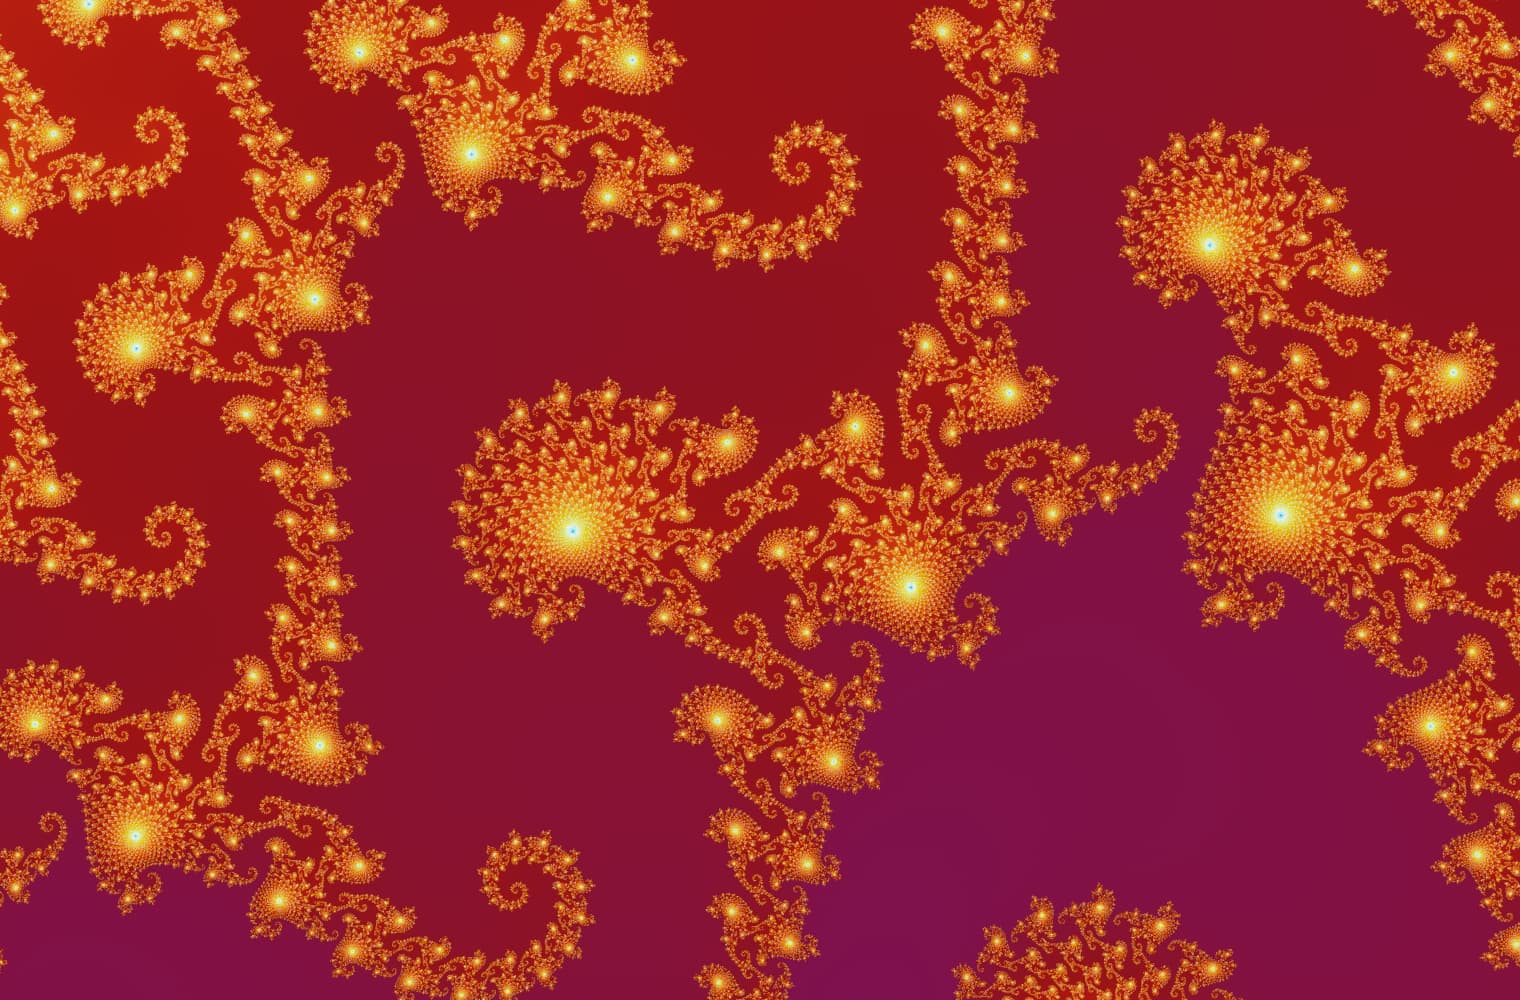
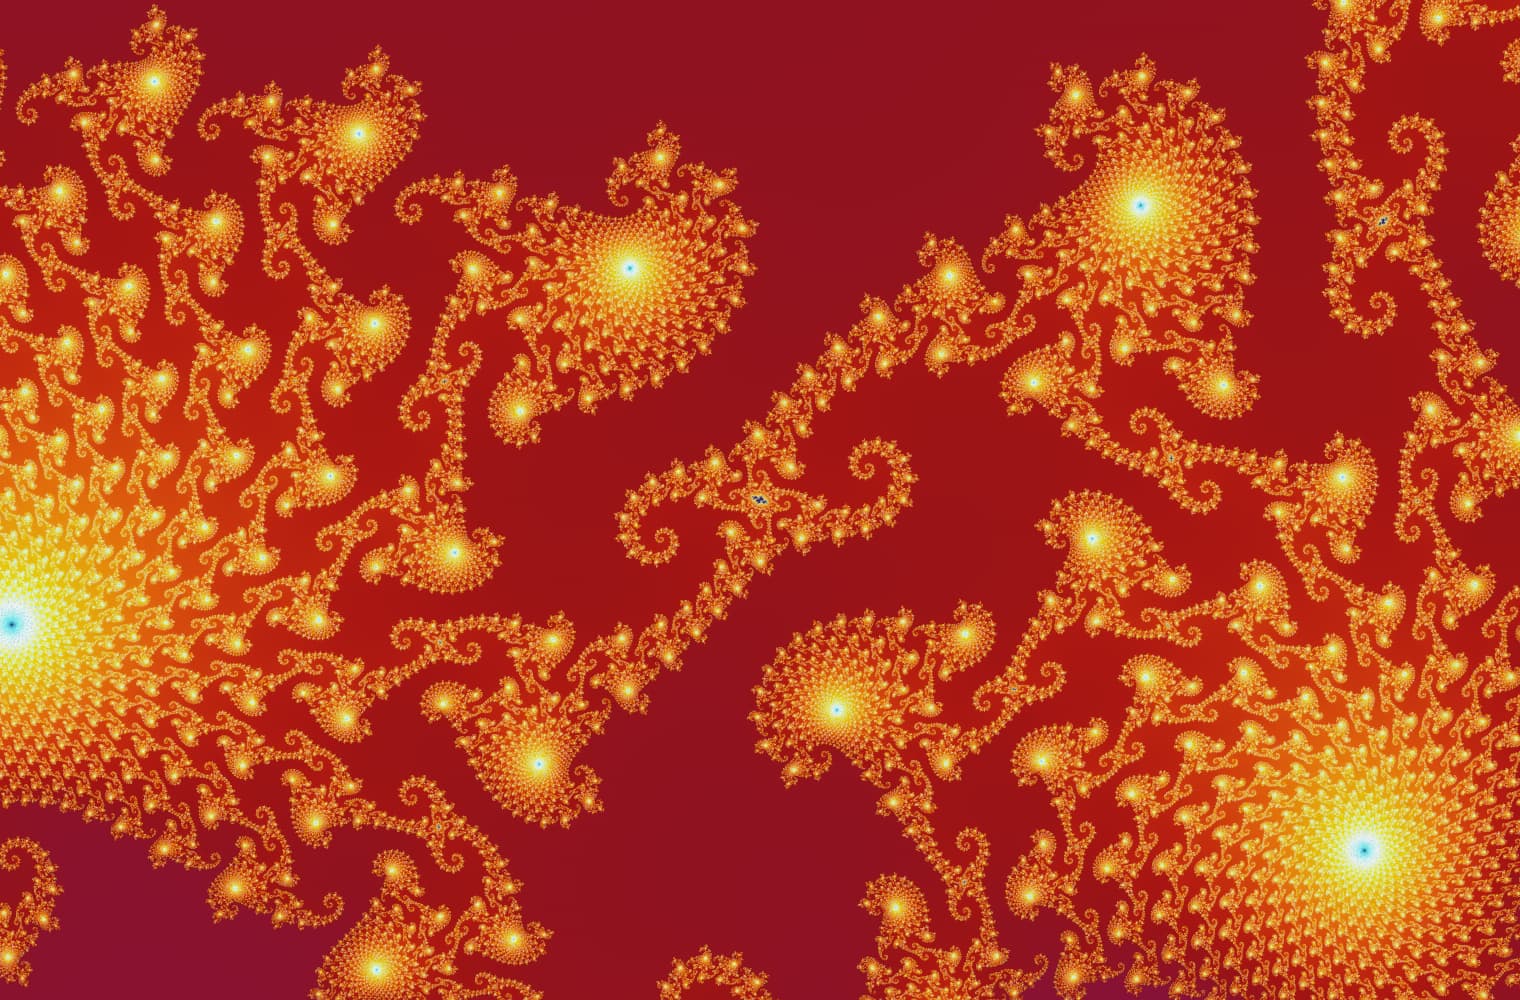
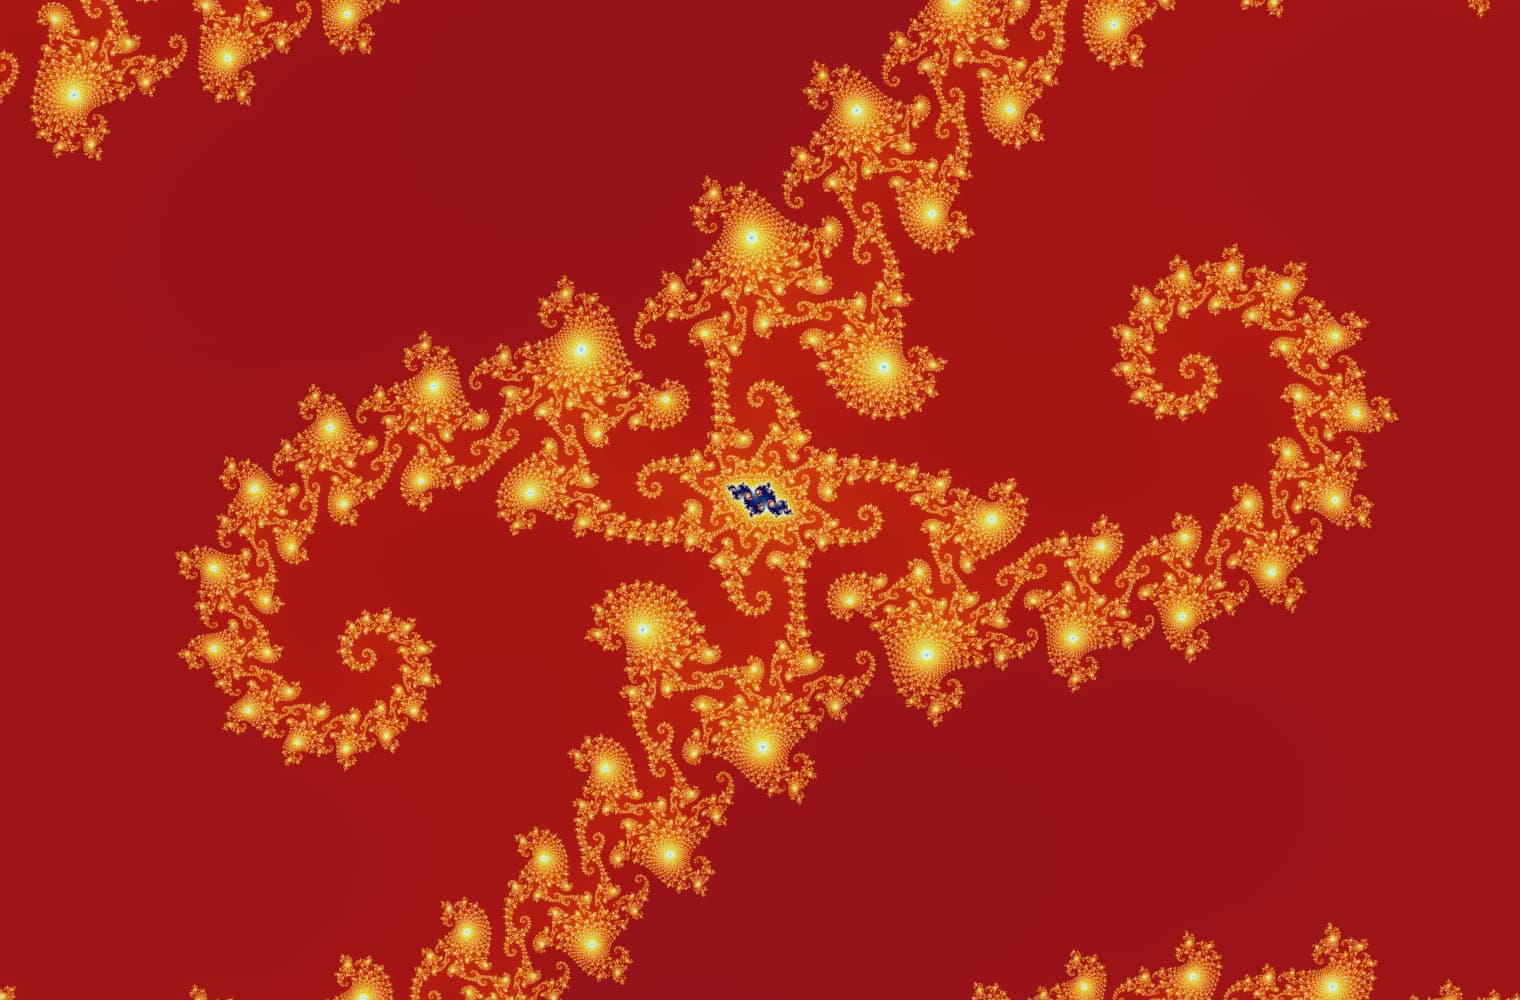
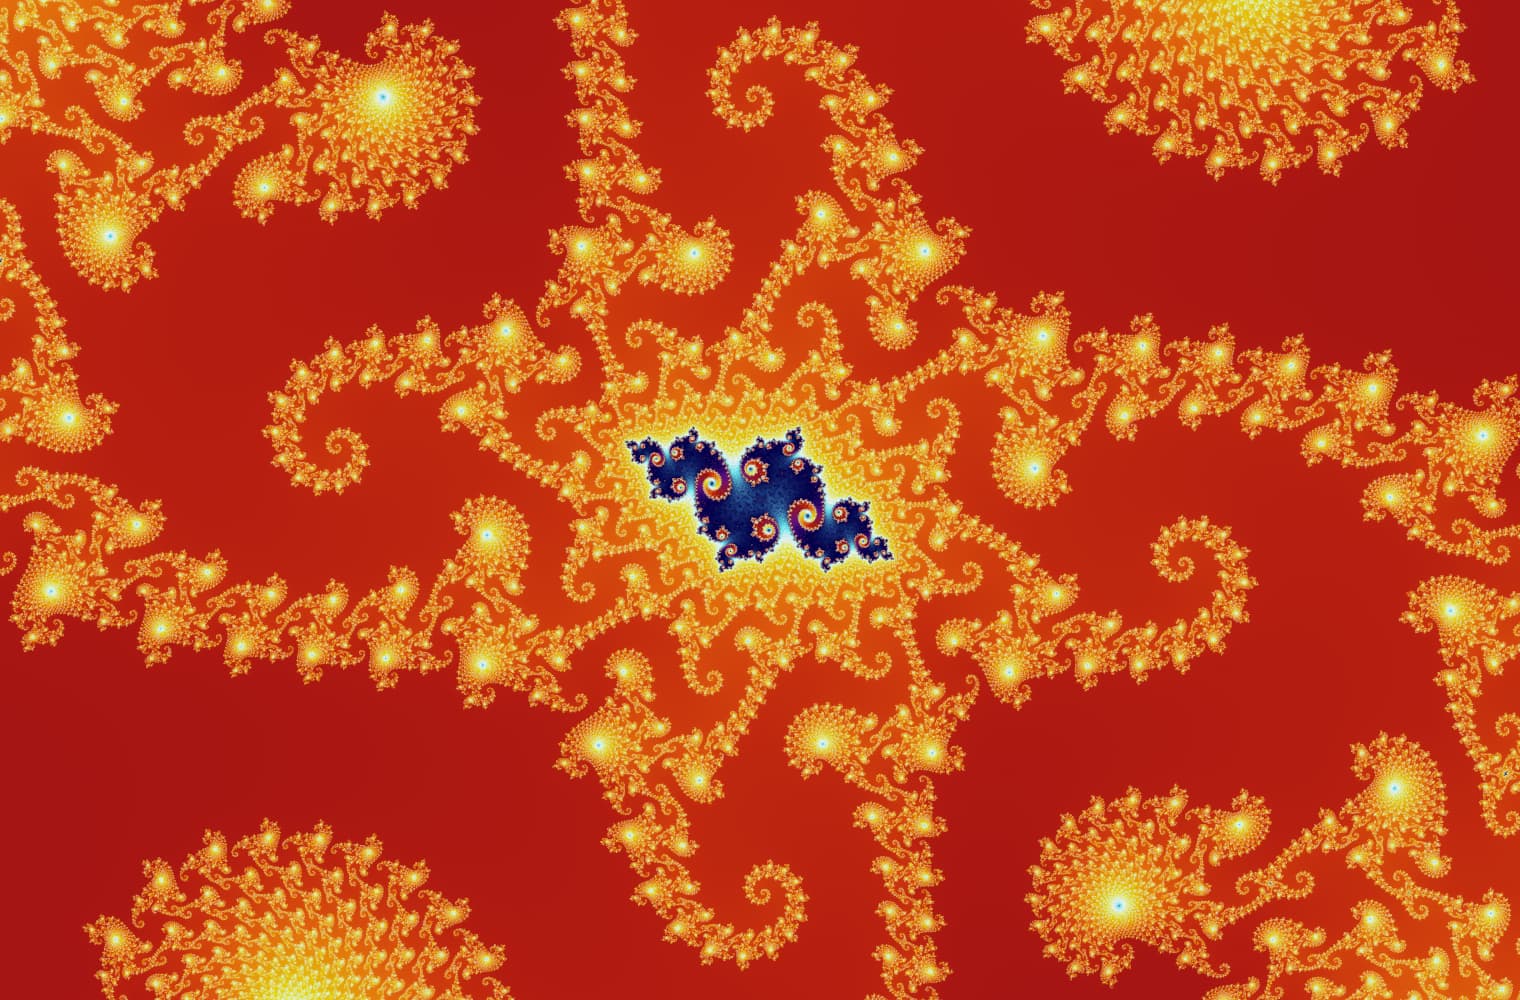

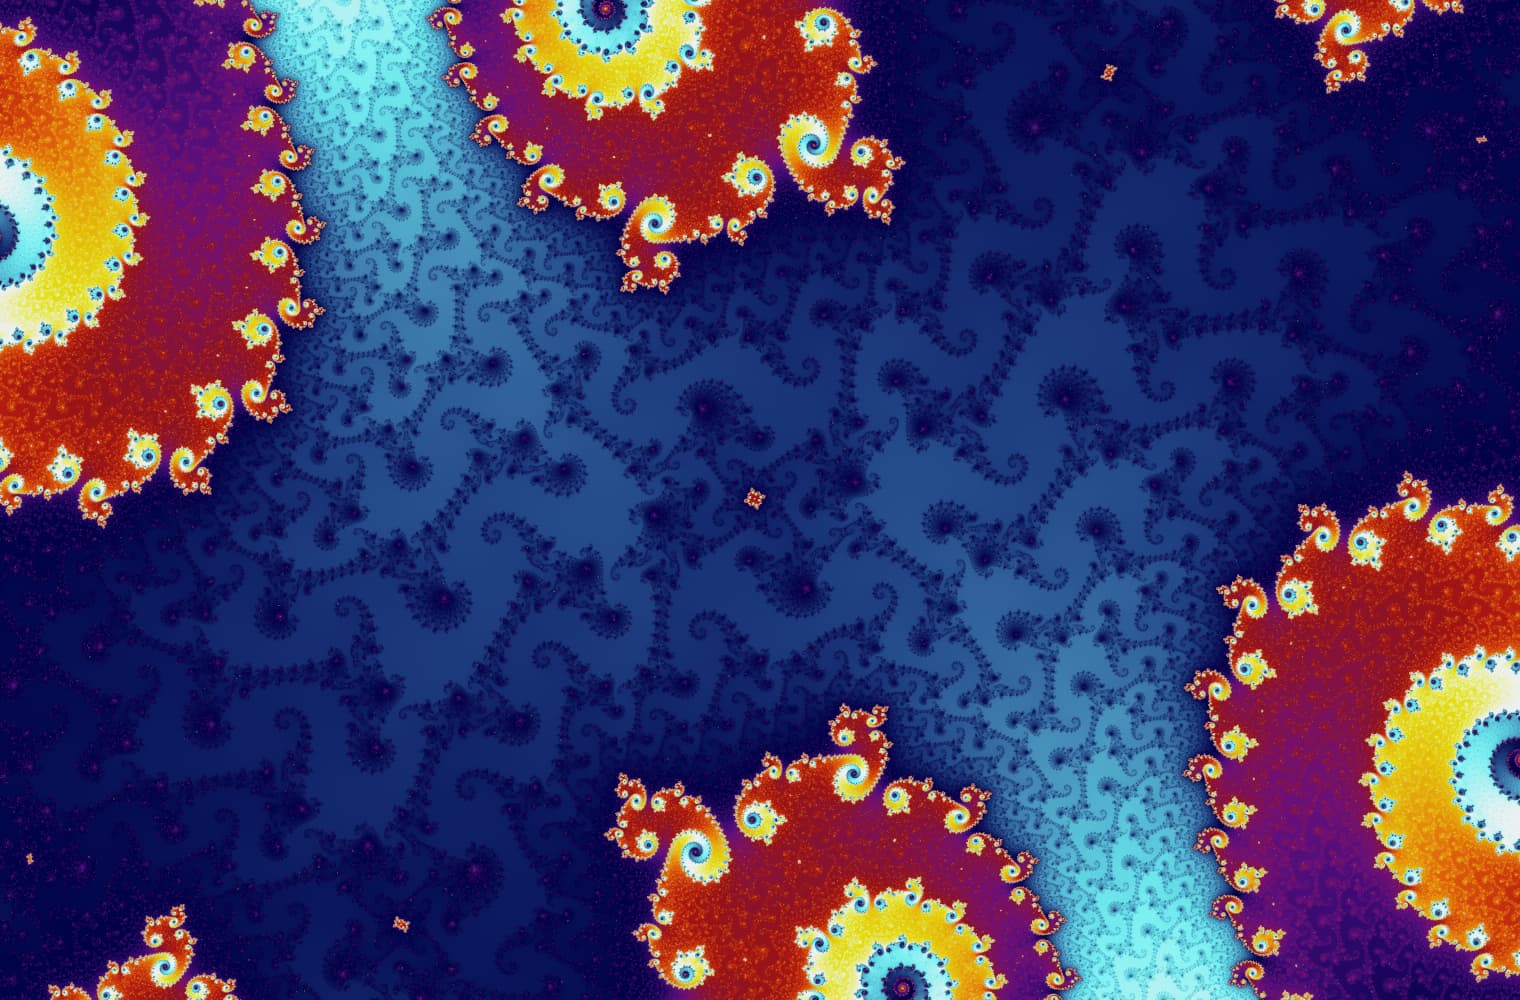
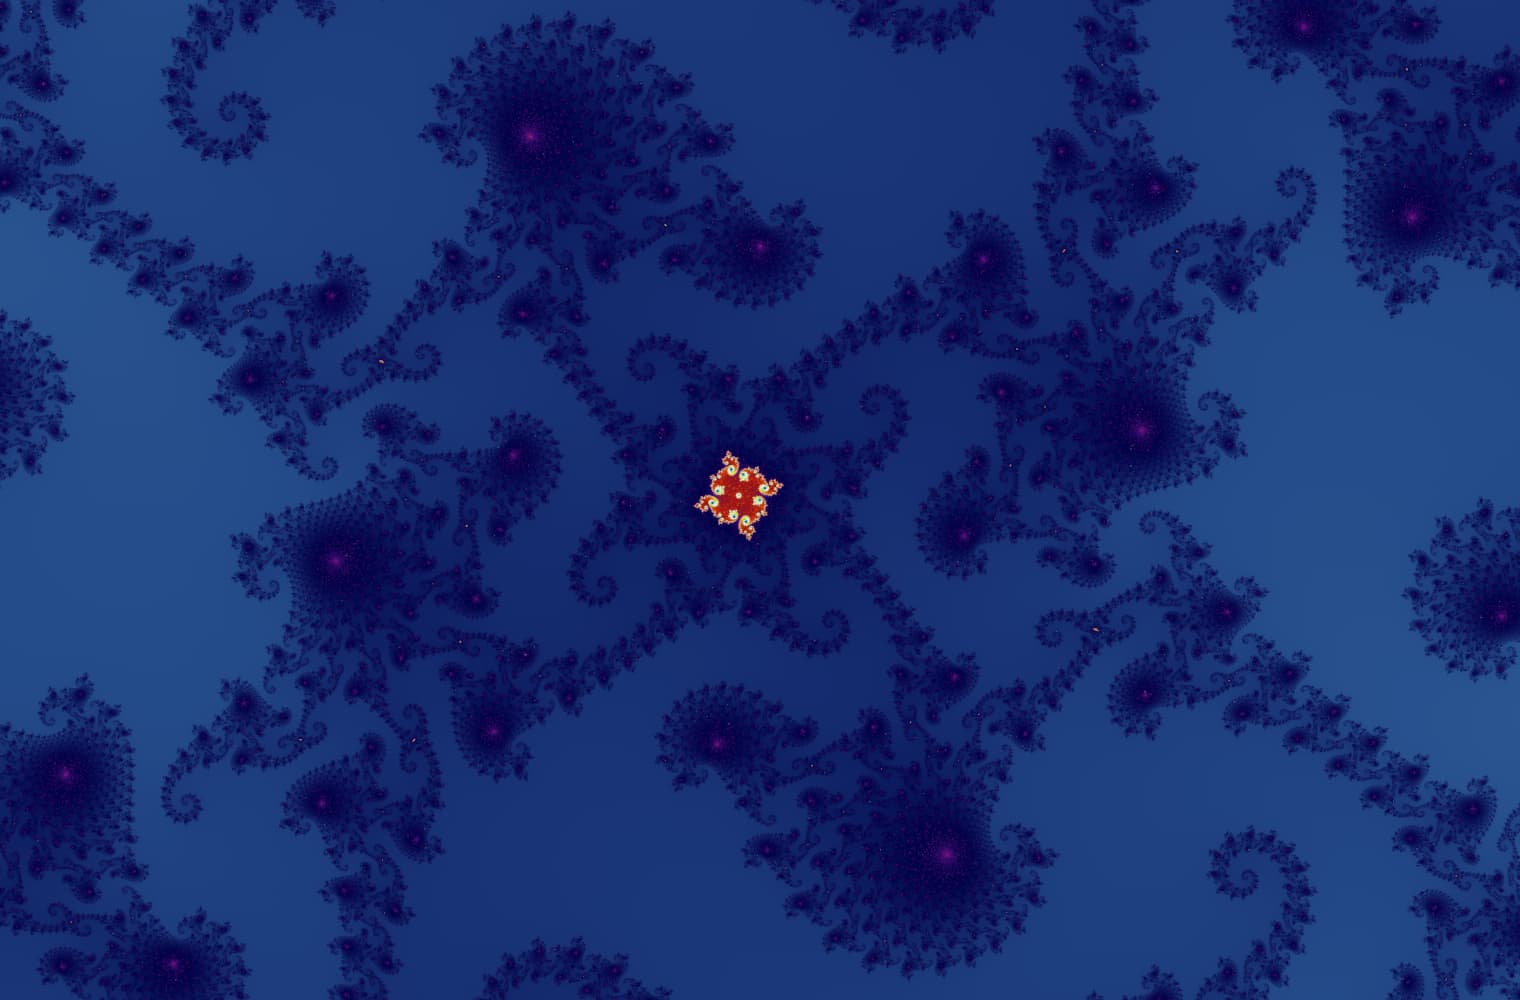
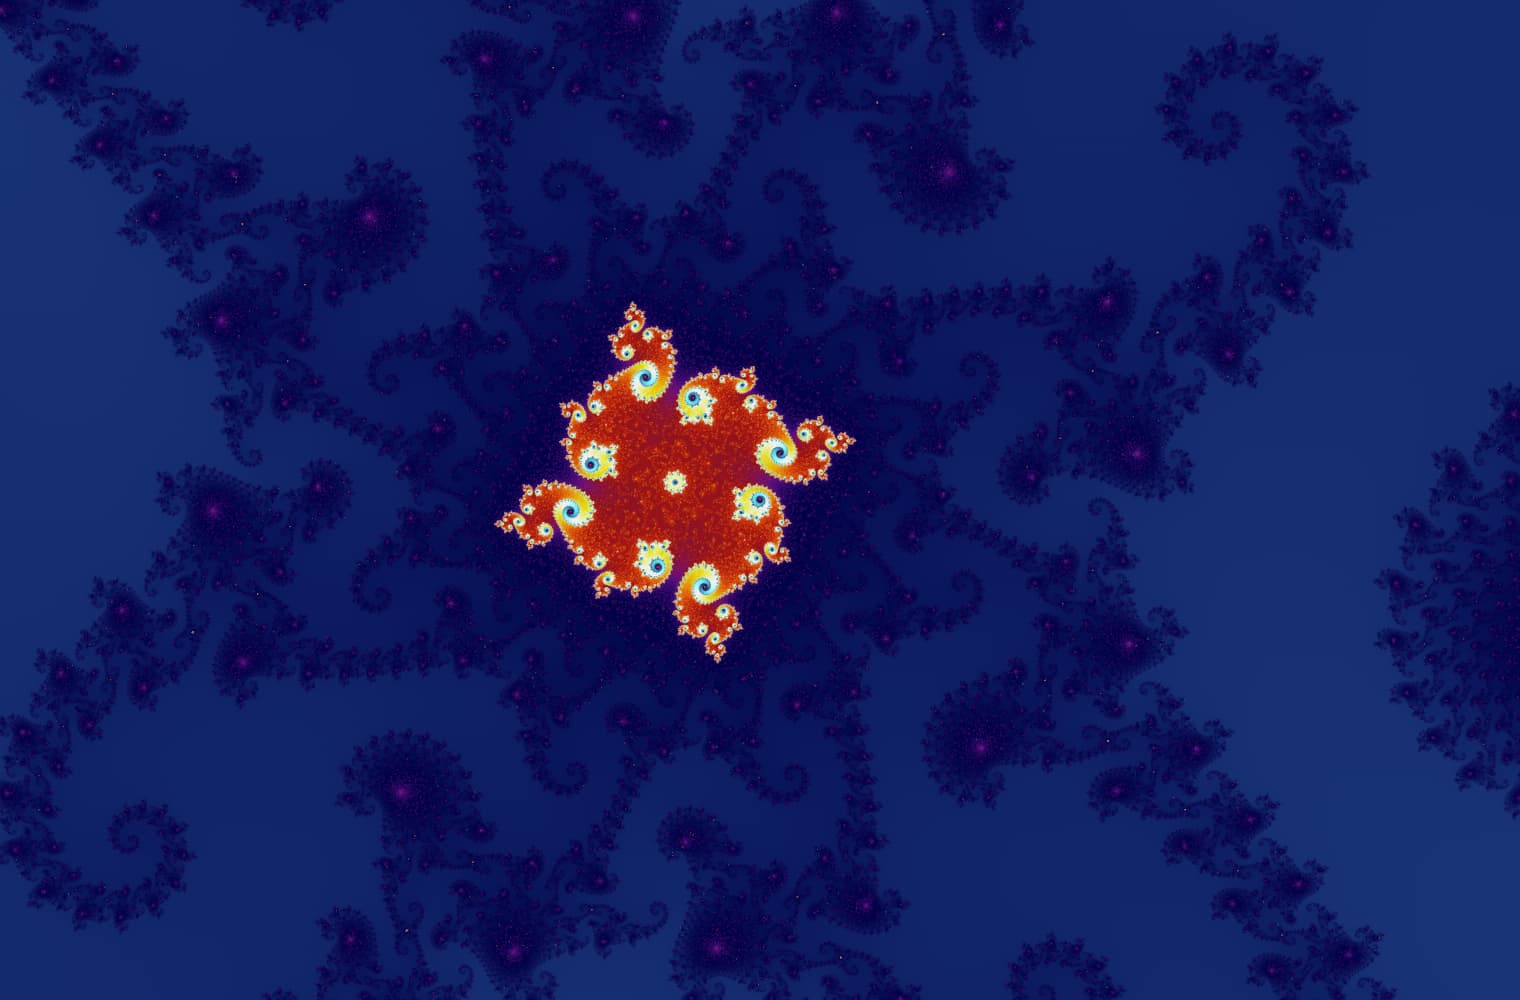
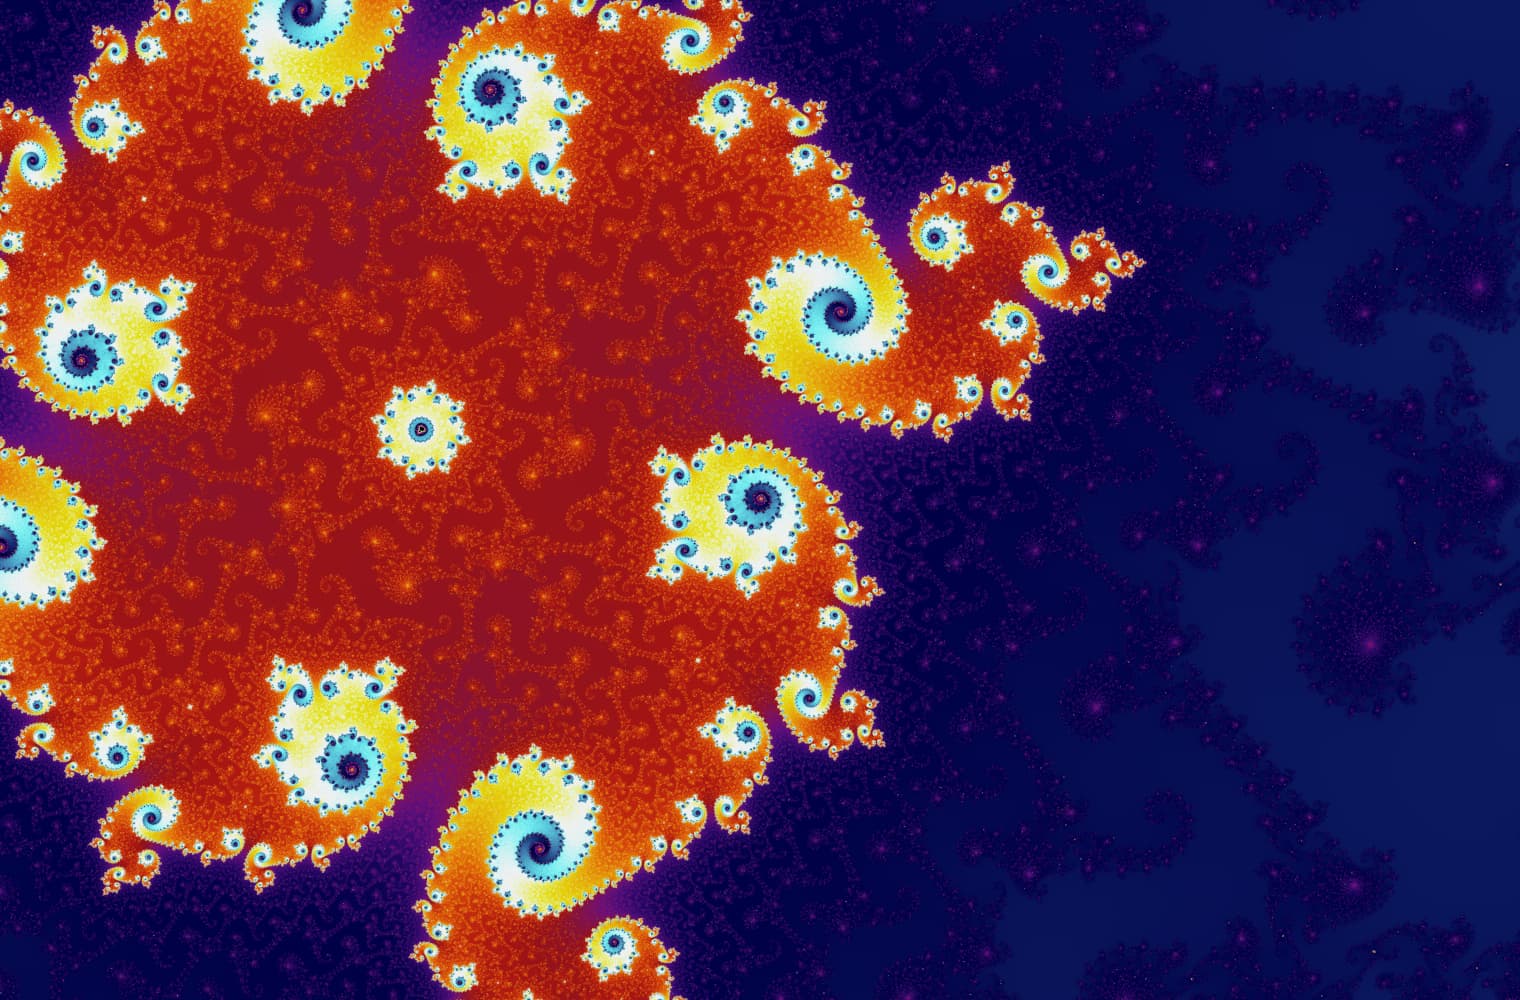
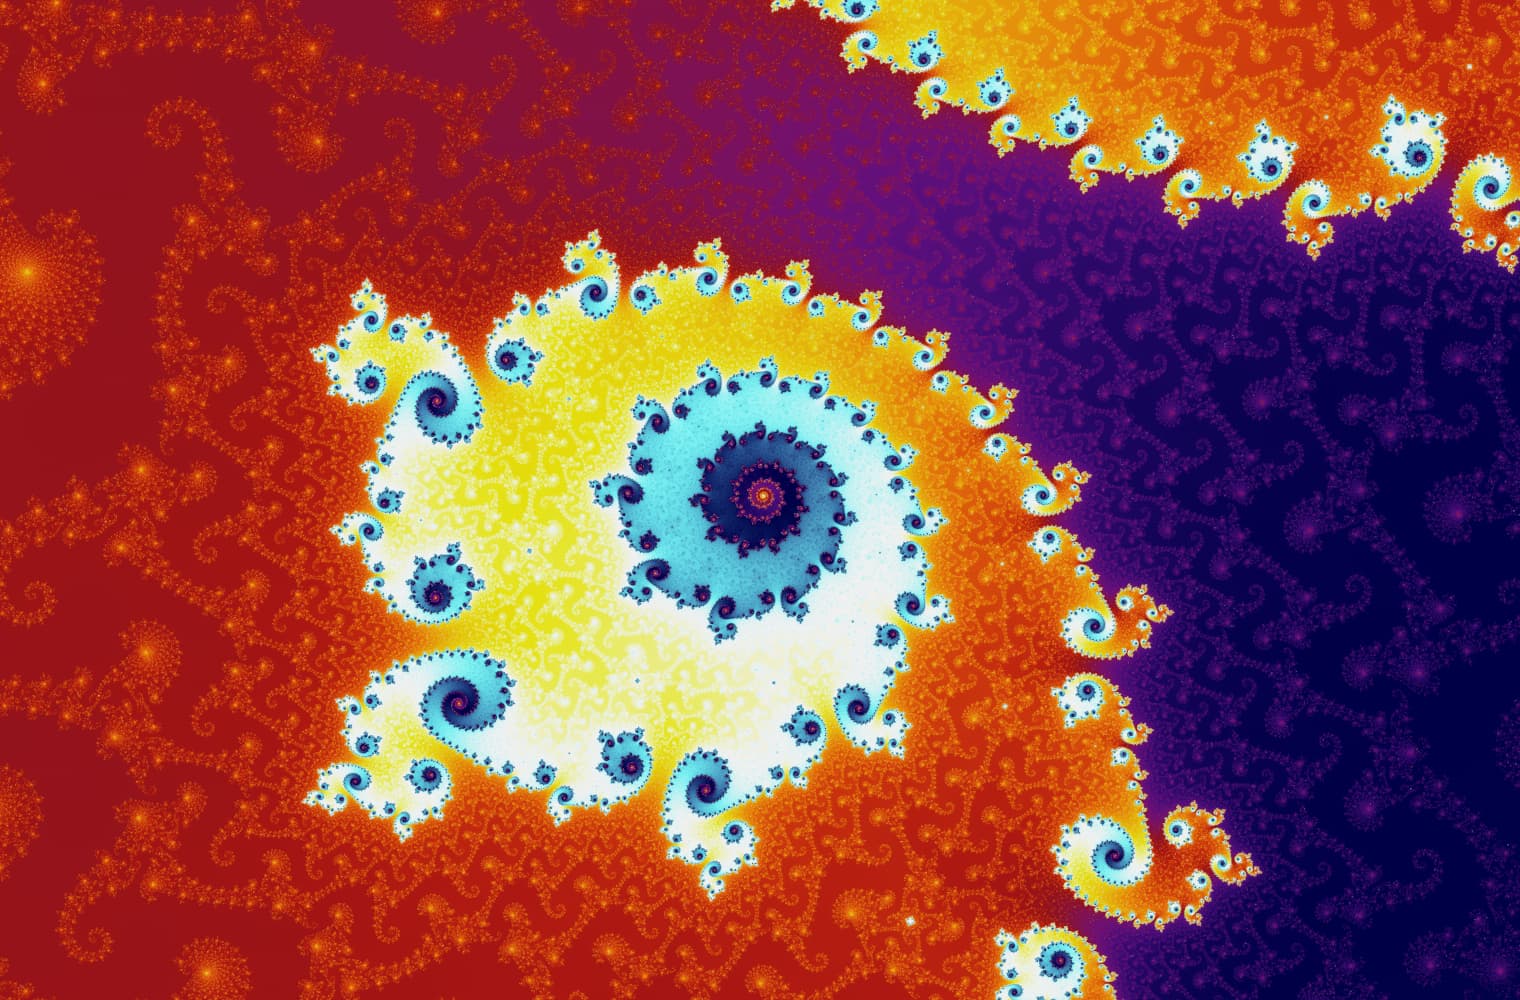


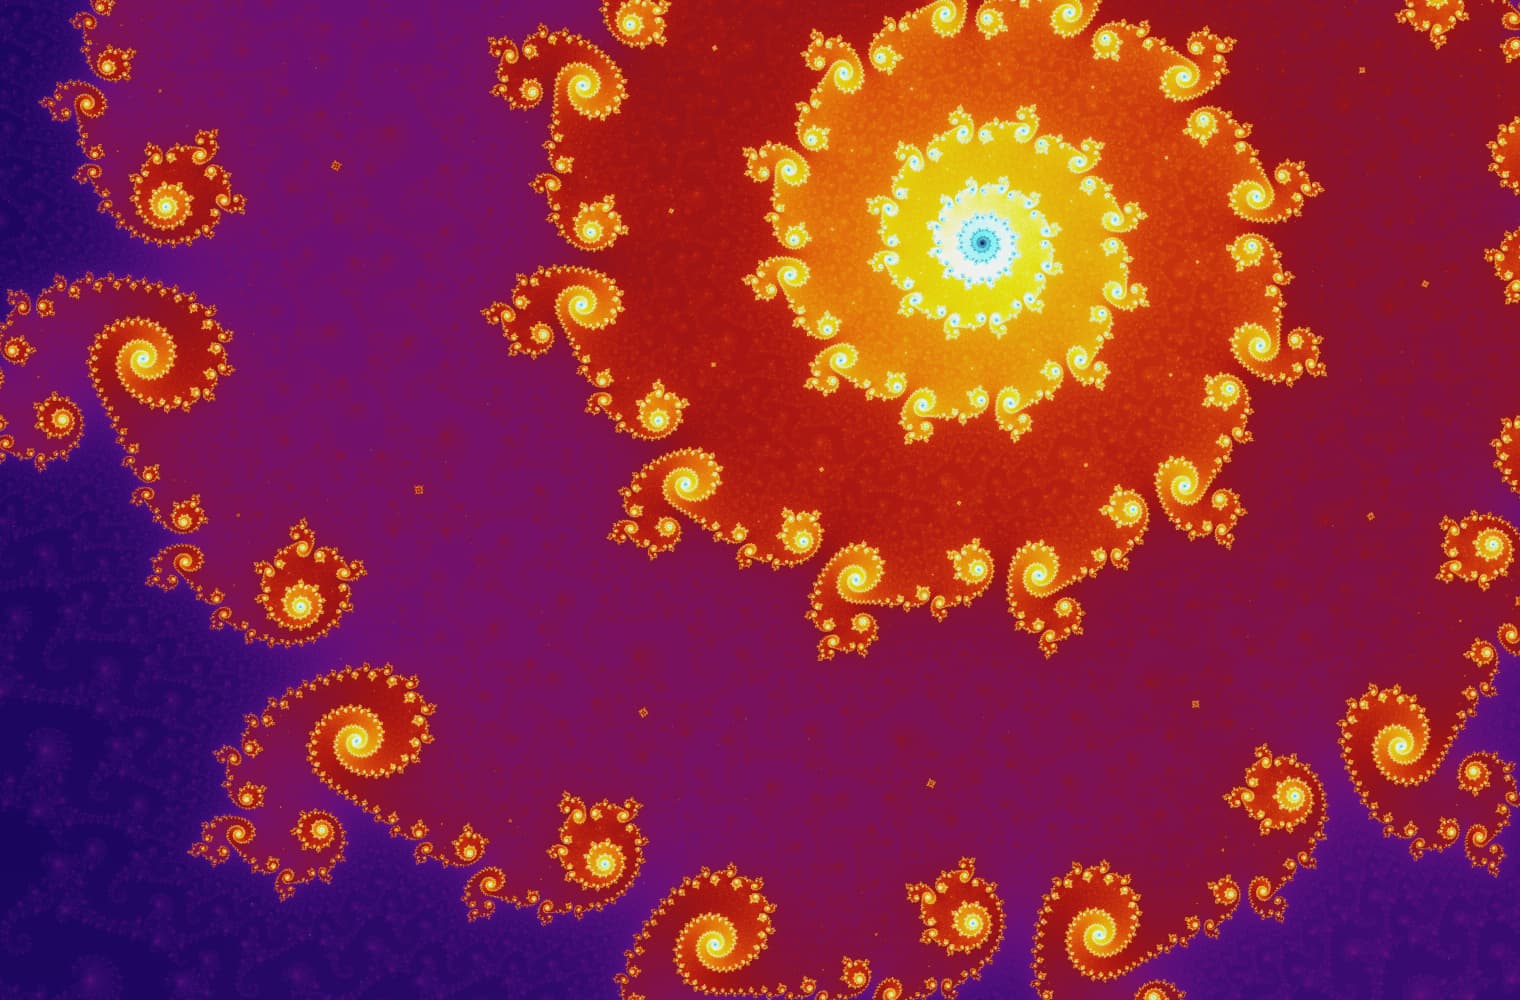
This slider consists of 27 individual images, up to a zoom level of over 14 quadrillion, or
As you move the value of c around the Mandelbrot set, you might notice a curious property:
- All sequences within the main body of the Mandelbrot set
to a single point. - The sequences within the large bulb at the top
consisting of points. - Sequences in this smaller bulb have orbits of length
.
Every bulb has a differently-sized orbit, with smaller bulbs having more and more points in their orbits. The size of these orbits are closely related to the Logistic Map, an important concept in Chaos theory.
Bernoit Mandelbrot dedicated most of his life to the study of fractals, as well as the mathematics of roughness and self-similarity. His work had applications in physics, meteorology, neurology, economics, geology, engineering, computer science, and many other fields.
In 1985, the Mandelbrot set appeared on the cover of the Scientific American magazine, and since then it has become one of the most recognisable mathematical shapes in the world. You can find it on T-shirts, in music videos, and as screen savers, and it’s been referenced in many popular books and movies.